29
/es/
es
AIzaSyAYiBZKx7MnpbEhh9jyipgxe19OcubqV5w
April 1, 2024
276678
United States
USA
true
2
1
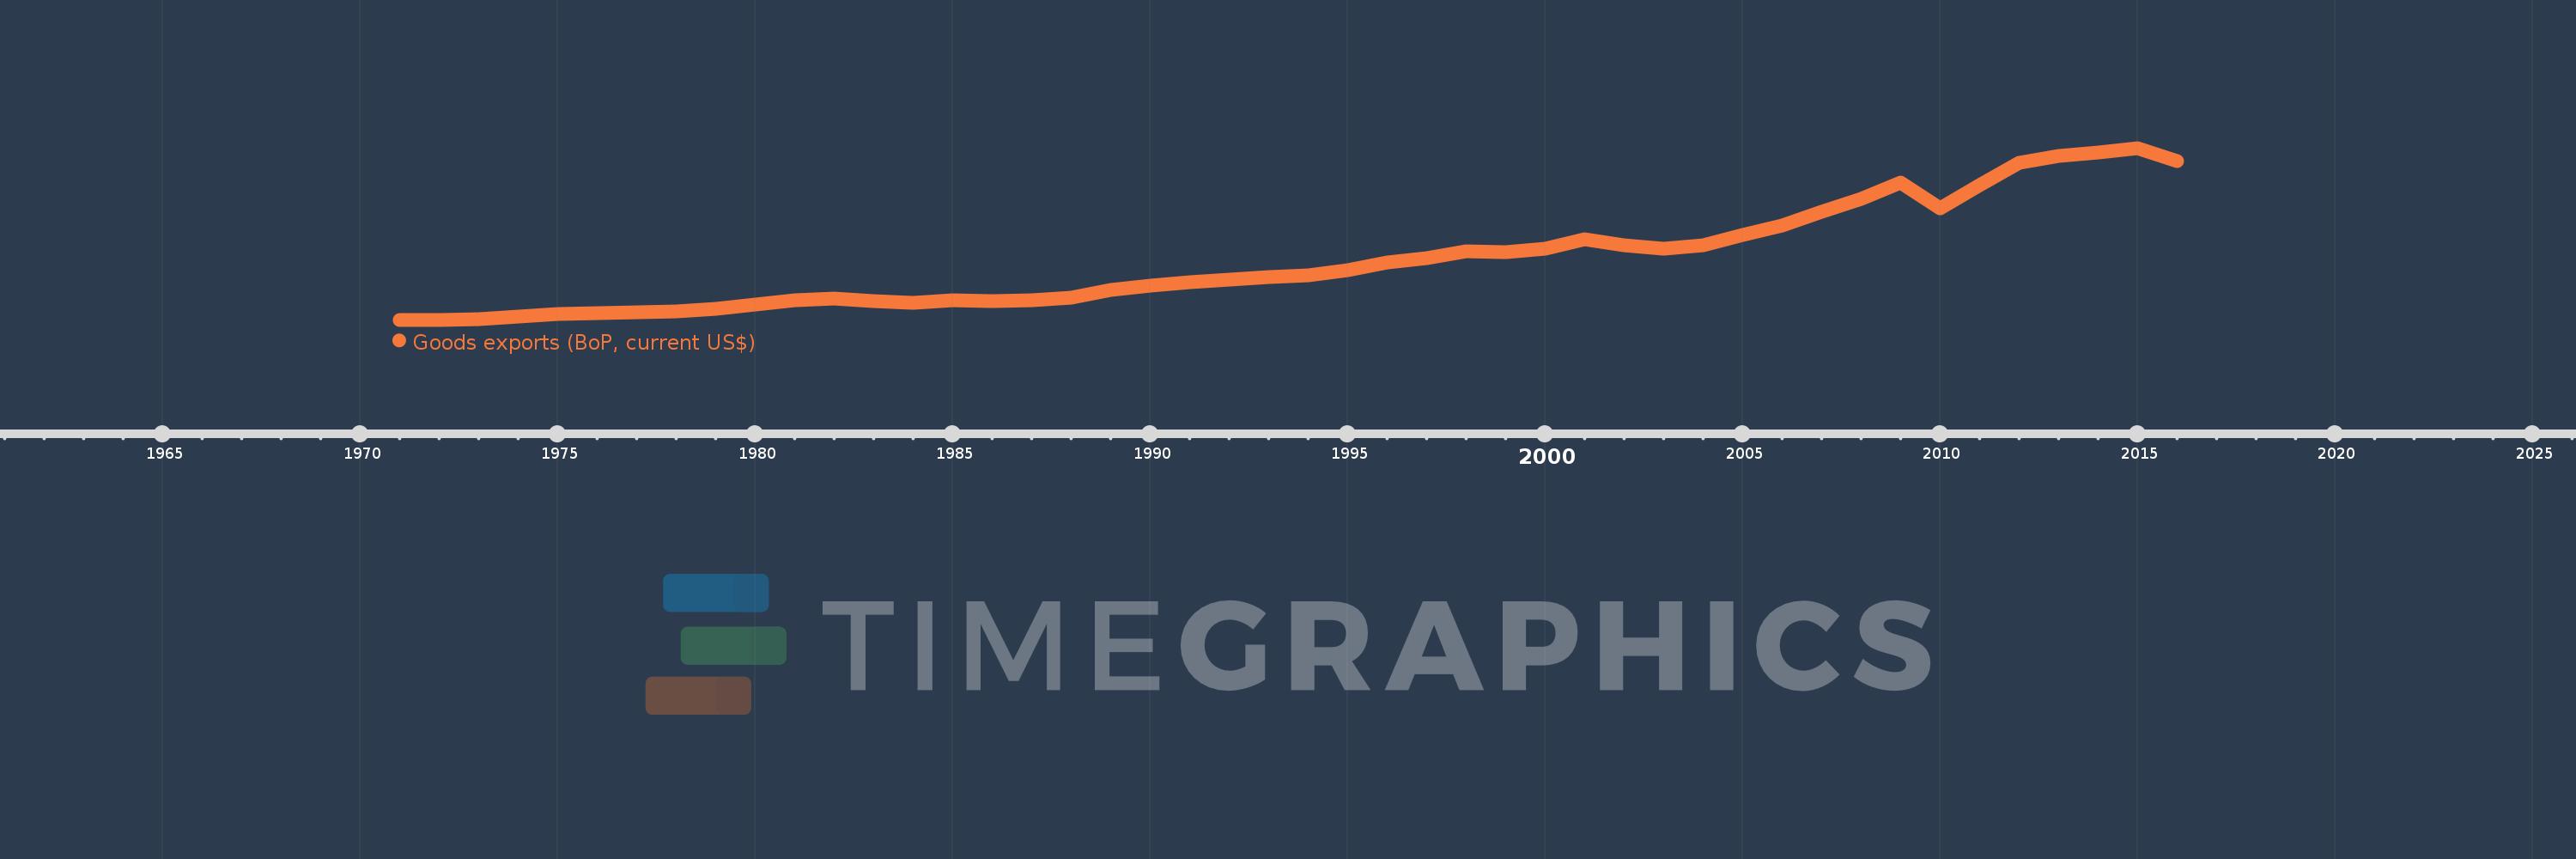
Goods exports (BoP, current US$)
2016,2015,2014,2013,2012,2011,2010,2009,2008,2007,2006,2005,2004,2003,2002,2001,2000,1999,1998,1997,1996,1995,1994,1993,1992,1991,1990,1989,1988,1987,1986,1985,1984,1983,1982,1981,1980,1979,1978,1977,1976,1975,1974,1973,1972,1971
Estas estadísticas en otros países:
AfghanistanAlbaniaAlgeriaAngolaAntigua and BarbudaArab WorldArgentinaArmeniaArubaAustraliaAustriaAzerbaijanBahamas, TheBahrainBangladeshBarbadosBelarusBelgiumBelizeBeninBermudaBhutanBoliviaBosnia and HerzegovinaBotswanaBrazilBrunei DarussalamBulgariaBurkina FasoBurundiCabo VerdeCambodiaCameroonCanadaCaribbean small statesCentral African RepublicCentral Europe and the BalticsChadChileChinaColombiaComorosCongo, Dem. Rep.Congo, Rep.Costa RicaCote d'IvoireCroatiaCuracaoCyprusCzech RepublicDenmarkDjiboutiDominicaDominican RepublicEarly-demographic dividendEast Asia & PacificEast Asia & Pacific (excluding high income)East Asia & Pacific (IDA & IBRD countries)EcuadorEgypt, Arab Rep.El SalvadorEquatorial GuineaEritreaEstoniaEthiopiaEuro areaEurope & Central AsiaEurope & Central Asia (excluding high income)Europe & Central Asia (IDA & IBRD countries)European UnionFaroe IslandsFijiFinlandFragile and conflict affected situationsFranceFrench PolynesiaGabonGambia, TheGeorgiaGermanyGhanaGreeceGrenadaGuatemalaGuineaGuinea-BissauGuyanaHaitiHeavily indebted poor countries (HIPC)High incomeHondurasHong Kong SAR, ChinaHungaryIBRD onlyIcelandIDA & IBRD totalIDA blendIDA onlyIDA totalIndiaIndonesiaIran, Islamic Rep.IraqIrelandIsraelItalyJamaicaJapanJordanKazakhstanKenyaKiribatiKorea, Rep.KosovoKuwaitKyrgyz RepublicLao PDRLate-demographic dividendLatin America & Caribbean Latin America & Caribbean (excluding high income)Latin America & the Caribbean (IDA & IBRD countries)LatviaLeast developed countries: UN classificationLebanonLesothoLiberiaLibyaLithuaniaLow & middle incomeLow incomeLower middle incomeLuxembourgMacao SAR, ChinaMacedonia, FYRMadagascarMalawiMalaysiaMaldivesMaliMaltaMarshall IslandsMauritaniaMauritiusMexicoMicronesia, Fed. Sts.Middle East & North Africa (excluding high income)Middle East & North Africa (IDA & IBRD countries)Middle incomeMoldovaMongoliaMontenegroMoroccoMozambiqueMyanmarNamibiaNepalNetherlandsNew CaledoniaNew ZealandNicaraguaNigerNigeriaNorth AmericaNorwayOECD membersOmanPacific island small statesPakistanPalauPanamaPapua New GuineaParaguayPeruPhilippinesPolandPortugalPost-demographic dividendPre-demographic dividendQatarRomaniaRussian FederationRwandaSamoaSao Tome and PrincipeSaudi ArabiaSenegalSerbiaSeychellesSierra LeoneSingaporeSint Maarten (Dutch part)Slovak RepublicSloveniaSolomon IslandsSouth AfricaSouth AsiaSouth Asia (IDA & IBRD)South SudanSpainSri LankaSt. Kitts and NevisSt. LuciaSt. Vincent and the GrenadinesSub-Saharan Africa Sub-Saharan Africa (excluding high income)Sub-Saharan Africa (IDA & IBRD countries)SudanSurinameSwazilandSwedenSwitzerlandSyrian Arab RepublicTajikistanTanzaniaThailandTimor-LesteTogoTongaTrinidad and TobagoTunisiaTurkeyTuvaluUgandaUkraineUnited KingdomUnited StatesUpper middle incomeUruguayVanuatuVenezuela, RBVietnamWest Bank and GazaWorldYemen, Rep.ZambiaZimbabwe línea de tiempo (timeline):
En esta escala de tiempo se presenta un gráfico de 1971 y 2016 de United States. Los datos de 1970 están ausentes. El número de observaciones reales por fecha: 46.
Fuente (nombre):
Indicadores del desarrollo mundial
Fuente (organización):
International Monetary Fund, Balance of Payments Statistics Yearbook and data files.
Categorías:
Economy & Growth, Trade
Se ha actualizado:
23 abr 2017 año
Los indicadores de los cambios de valor en los últimos años
Mínimo:
42.45 bn
1 ene 1971 año
Máximo:
1.633 billones
1 ene 2015 año
A la fecha de observación
Valor
Cambio absoluto
El cambio con respecto al valor anterior
1 ene 1971 año
42.45 bn
+42.45 bn
0.0%
1 ene 1972 año
43.31 bn
+860.0 millones
2.03%
1 ene 1973 año
49.38 bn
+6.07 bn
14.02%
1 ene 1974 año
71.41 bn
+22.03 bn
44.61%
1 ene 1975 año
98.31 bn
+26.9 bn
37.67%
1 ene 1976 año
107.09 bn
+8.78 bn
8.93%
1 ene 1977 año
114.74 bn
+7.65 bn
7.14%
1 ene 1978 año
120.81 bn
+6.07 bn
5.29%
1 ene 1979 año
142.075 bn
+21.265 bn
17.6%
1 ene 1980 año
184.439 bn
+42.364 bn
29.82%
1 ene 1981 año
224.238 bn
+39.799 bn
21.58%
1 ene 1982 año
237.045 bn
+12.807 bn
5.71%
1 ene 1983 año
211.177 bn
-25.868 bn
-10.91%
1 ene 1984 año
201.798 bn
-9.379 bn
-4.44%
1 ene 1985 año
219.933 bn
+18.135 bn
8.99%
1 ene 1986 año
215.917 bn
-4.016 bn
-1.83%
1 ene 1987 año
223.342 bn
+7.425 bn
3.44%
1 ene 1988 año
250.21 bn
+26.868 bn
12.03%
1 ene 1989 año
320.228 bn
+70.018 bn
27.98%
1 ene 1990 año
359.923 bn
+39.695 bn
12.4%
1 ene 1991 año
387.398 bn
+27.475 bn
7.63%
1 ene 1992 año
414.077 bn
+26.679 bn
6.89%
1 ene 1993 año
439.631 bn
+25.554 bn
6.17%
1 ene 1994 año
456.943 bn
+17.312 bn
3.94%
1 ene 1995 año
502.859 bn
+45.916 bn
10.05%
1 ene 1996 año
575.204 bn
+72.345 bn
14.39%
1 ene 1997 año
612.113 bn
+36.909 bn
6.42%
1 ene 1998 año
678.366 bn
+66.253 bn
10.82%
1 ene 1999 año
670.416 bn
-7.95 bn
-1.17%
1 ene 2000 año
698.524 bn
+28.108 bn
4.19%
1 ene 2001 año
784.939 bn
+86.415 bn
12.37%
1 ene 2002 año
731.331 bn
-53.608 bn
-6.83%
1 ene 2003 año
698.036 bn
-33.295 bn
-4.55%
1 ene 2004 año
730.445 bn
+32.409 bn
4.64%
1 ene 2005 año
823.584 bn
+93.139 bn
12.75%
1 ene 2006 año
913.016 bn
+89.432 bn
10.86%
1 ene 2007 año
1.041 billones
+127.889 bn
14.01%
1 ene 2008 año
1.165 billones
+124.248 bn
11.94%
1 ene 2009 año
1.309 billones
+143.641 bn
12.33%
1 ene 2010 año
1.07 billones
-238.464 bn
-18.22%
1 ene 2011 año
1.29 billones
+219.944 bn
20.55%
1 ene 2012 año
1.499 billones
+208.966 bn
16.2%
1 ene 2013 año
1.563 billones
+63.337 bn
4.22%
1 ene 2014 año
1.592 billones
+29.426 bn
1.88%
1 ene 2015 año
1.633 billones
+41.317 bn
2.6%
1 ene 2016 año
1.51 billones
-123.017 bn
-7.53%
Ranking de los países por los datos estadísticos actuales


Comentarios: