29
/es/
es
AIzaSyAYiBZKx7MnpbEhh9jyipgxe19OcubqV5w
April 1, 2024
64268
Albania
ALB
true
2
1
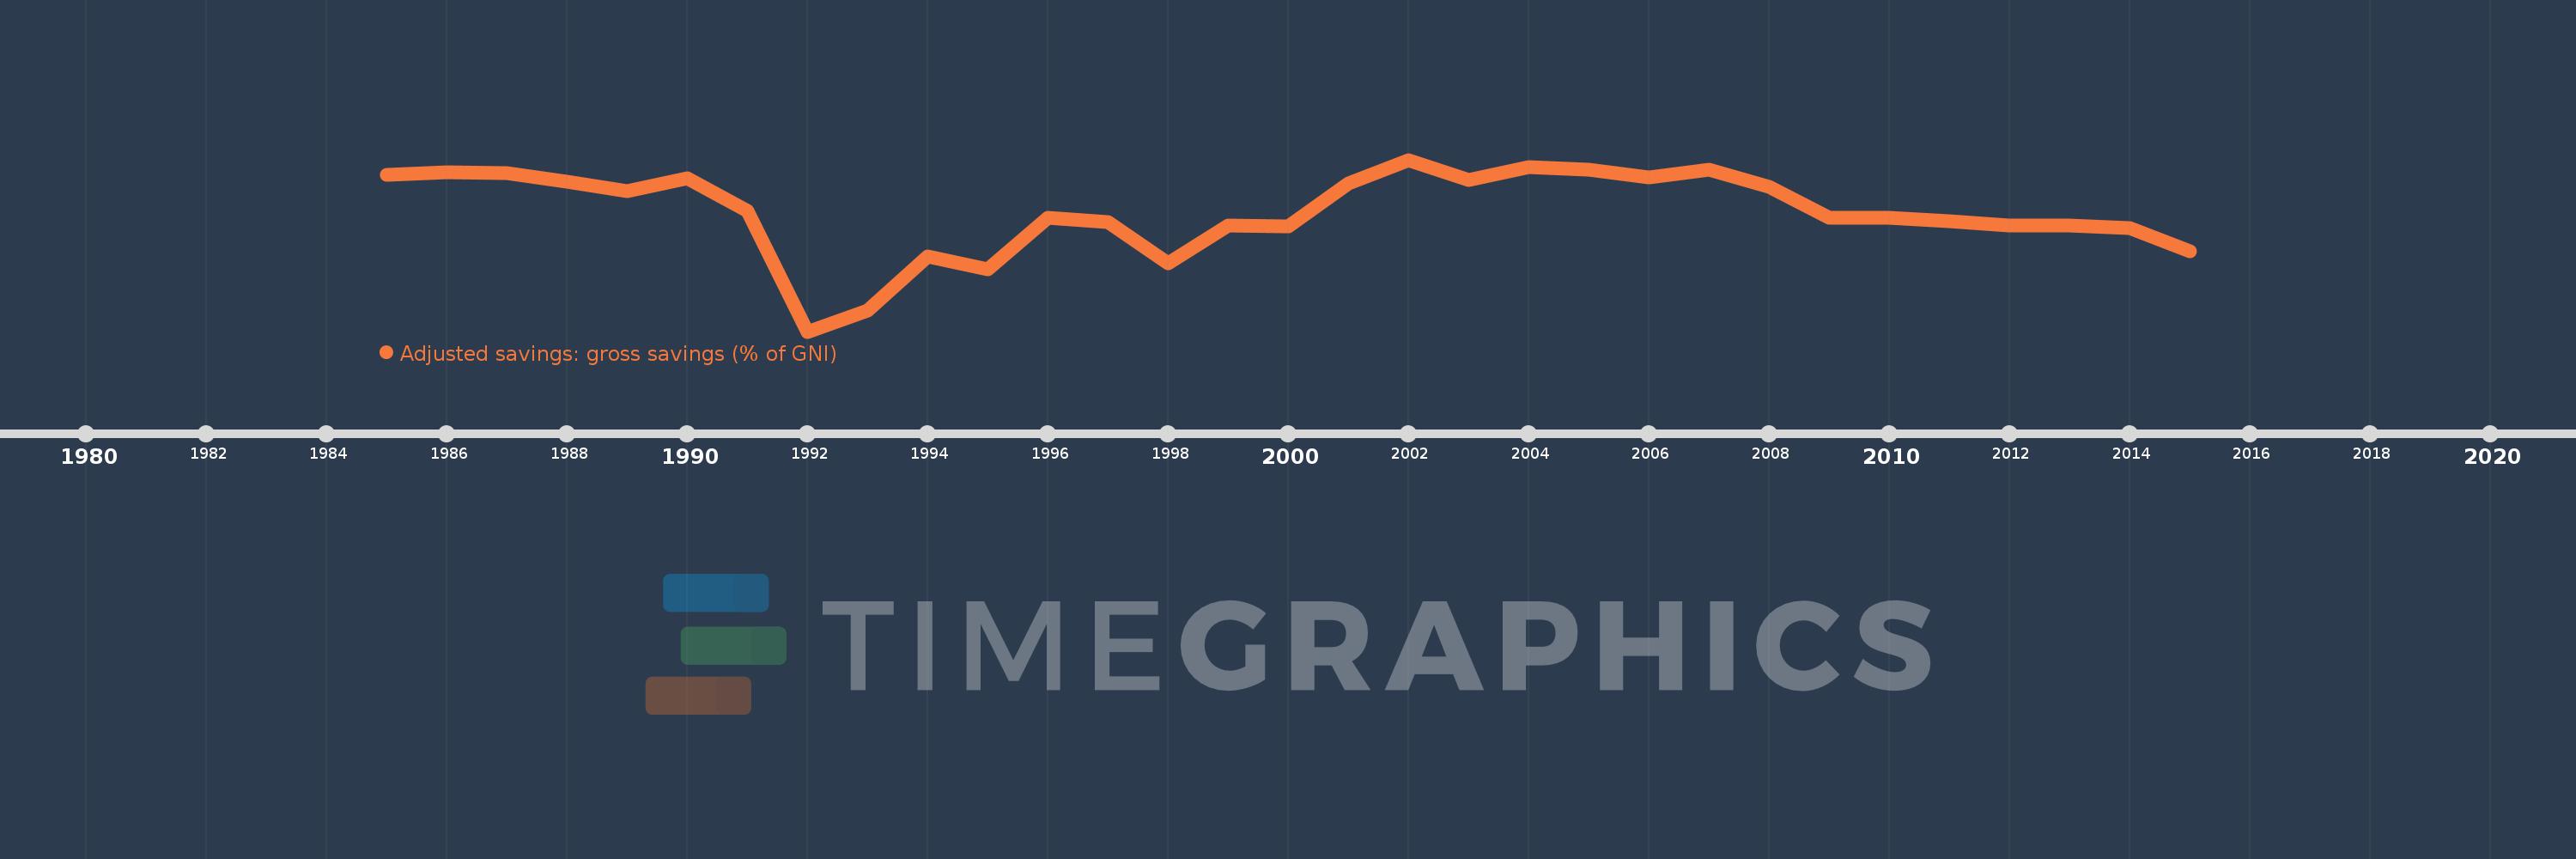
Adjusted savings: gross savings (% of GNI)
2015,2014,2013,2012,2011,2010,2009,2008,2007,2006,2005,2004,2003,2002,2001,2000,1999,1998,1997,1996,1995,1994,1993,1992,1991,1990,1989,1988,1987,1986,1985
Estas estadísticas en otros países:
AfghanistanAlbaniaAlgeriaAngolaAntigua and BarbudaArab WorldArgentinaArmeniaAustraliaAustriaAzerbaijanBahamas, TheBahrainBangladeshBarbadosBelarusBelgiumBelizeBeninBermudaBhutanBoliviaBosnia and HerzegovinaBotswanaBrazilBrunei DarussalamBulgariaBurkina FasoBurundiCabo VerdeCambodiaCameroonCanadaCaribbean small statesCentral African RepublicCentral Europe and the BalticsChadChileChinaColombiaComorosCongo, Dem. Rep.Congo, Rep.Costa RicaCote d'IvoireCroatiaCyprusCzech RepublicDenmarkDjiboutiDominicaDominican RepublicEarly-demographic dividendEast Asia & PacificEast Asia & Pacific (excluding high income)East Asia & Pacific (IDA & IBRD countries)EcuadorEgypt, Arab Rep.El SalvadorEquatorial GuineaEritreaEstoniaEthiopiaEuro areaEurope & Central AsiaEurope & Central Asia (excluding high income)Europe & Central Asia (IDA & IBRD countries)European UnionFaroe IslandsFijiFinlandFragile and conflict affected situationsFranceGabonGambia, TheGeorgiaGermanyGhanaGreeceGrenadaGuatemalaGuineaGuinea-BissauGuyanaHaitiHeavily indebted poor countries (HIPC)High incomeHondurasHong Kong SAR, ChinaHungaryIBRD onlyIcelandIDA & IBRD totalIDA blendIDA onlyIDA totalIndiaIndonesiaIran, Islamic Rep.IraqIrelandIsraelItalyJamaicaJapanJordanKazakhstanKenyaKiribatiKorea, Rep.KosovoKuwaitKyrgyz RepublicLao PDRLate-demographic dividendLatin America & Caribbean Latin America & Caribbean (excluding high income)Latin America & the Caribbean (IDA & IBRD countries)LatviaLeast developed countries: UN classificationLebanonLesothoLiberiaLibyaLithuaniaLow & middle incomeLow incomeLower middle incomeLuxembourgMacao SAR, ChinaMacedonia, FYRMadagascarMalawiMalaysiaMaldivesMaliMaltaMauritaniaMauritiusMexicoMiddle East & North AfricaMiddle East & North Africa (excluding high income)Middle East & North Africa (IDA & IBRD countries)Middle incomeMoldovaMongoliaMontenegroMoroccoMozambiqueNamibiaNepalNetherlandsNew ZealandNicaraguaNigerNigeriaNorth AmericaNorwayOECD membersOmanOther small statesPacific island small statesPakistanPanamaPapua New GuineaParaguayPeruPhilippinesPolandPortugalPost-demographic dividendPre-demographic dividendQatarRomaniaRussian FederationRwandaSaudi ArabiaSenegalSerbiaSeychellesSierra LeoneSingaporeSlovak RepublicSloveniaSmall statesSolomon IslandsSouth AfricaSouth AsiaSouth Asia (IDA & IBRD)SpainSri LankaSt. Kitts and NevisSt. LuciaSt. Vincent and the GrenadinesSub-Saharan Africa Sub-Saharan Africa (excluding high income)Sub-Saharan Africa (IDA & IBRD countries)SudanSurinameSwazilandSwedenSwitzerlandSyrian Arab RepublicTajikistanTanzaniaThailandTimor-LesteTogoTongaTrinidad and TobagoTunisiaTurkeyTurkmenistanUgandaUkraineUnited KingdomUnited StatesUpper middle incomeUruguayVanuatuVenezuela, RBVietnamWest Bank and GazaWorldYemen, Rep.ZambiaZimbabwe línea de tiempo (timeline):
En esta escala de tiempo se presenta un gráfico de 1985 y 2015 de Albania. Los datos de 1984 están ausentes. El número de observaciones reales por fecha: 31.
Fuente (nombre):
Indicadores del desarrollo mundial
Fuente (organización):
World Bank national accounts data files.
Categorías:
Economy & Growth, Environment
Se ha actualizado:
23 abr 2017 año
Los indicadores de los cambios de valor en los últimos años
Mínimo:
-7.232
1 ene 1992 año
Máximo:
33.909
1 ene 2002 año
A la fecha de observación
Valor
Cambio absoluto
El cambio con respecto al valor anterior
1 ene 1985 año
30.27
+30.27
0.0%
1 ene 1986 año
30.877
+0.607
2.0%
1 ene 1987 año
30.764
-0.113
-0.37%
1 ene 1988 año
28.655
-2.109
-6.85%
1 ene 1989 año
26.404
-2.251
-7.85%
1 ene 1990 año
29.395
+2.99
11.32%
1 ene 1991 año
21.621
-7.773
-26.45%
1 ene 1992 año
-7.232
-28.853
-133.45%
1 ene 1993 año
-2.149
+5.083
-70.28%
1 ene 1994 año
10.666
+12.815
-596.27%
1 ene 1995 año
7.757
-2.909
-27.27%
1 ene 1996 año
20.091
+12.334
159.0%
1 ene 1997 año
18.937
-1.154
-5.74%
1 ene 1998 año
9.174
-9.764
-51.56%
1 ene 1999 año
18.165
+8.991
98.01%
1 ene 2000 año
17.957
-0.207
-1.14%
1 ene 2001 año
28.327
+10.37
57.75%
1 ene 2002 año
33.909
+5.582
19.7%
1 ene 2003 año
29.002
-4.906
-14.47%
1 ene 2004 año
32.238
+3.236
11.16%
1 ene 2005 año
31.589
-0.65
-2.02%
1 ene 2006 año
29.607
-1.982
-6.27%
1 ene 2007 año
31.506
+1.899
6.42%
1 ene 2008 año
27.347
-4.16
-13.2%
1 ene 2009 año
20.043
-7.303
-26.71%
1 ene 2010 año
19.987
-0.057
-0.28%
1 ene 2011 año
19.169
-0.818
-4.09%
1 ene 2012 año
18.248
-0.921
-4.8%
1 ene 2013 año
18.267
+0.018
0.1%
1 ene 2014 año
17.576
-0.69
-3.78%
1 ene 2015 año
11.962
-5.614
-31.94%
Ranking de los países por los datos estadísticos actuales


Comentarios: