29
/es/
es
AIzaSyAYiBZKx7MnpbEhh9jyipgxe19OcubqV5w
April 1, 2024
186116
Malawi
MWI
true
2
1
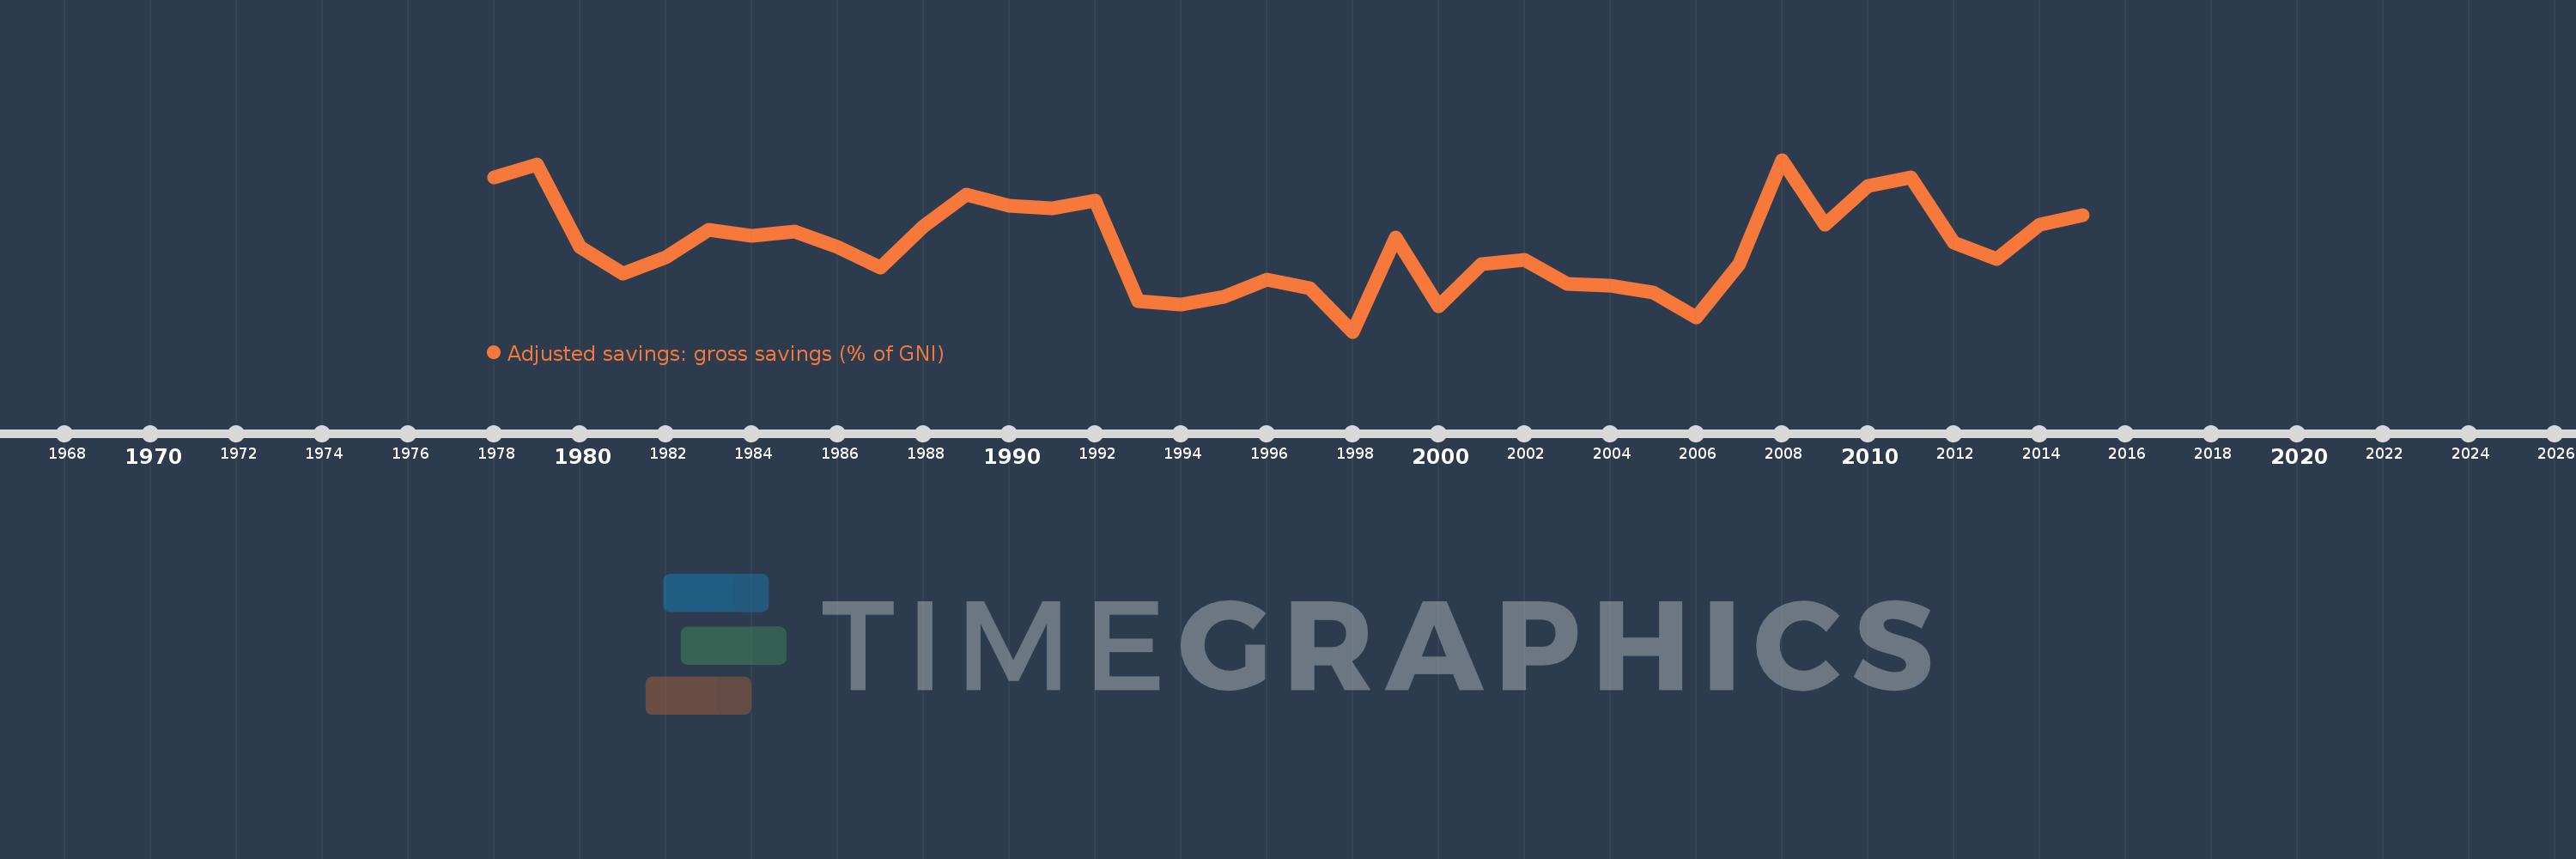
Adjusted savings: gross savings (% of GNI)
2015,2014,2013,2012,2011,2010,2009,2008,2007,2006,2005,2004,2003,2002,2001,2000,1999,1998,1997,1996,1995,1994,1993,1992,1991,1990,1989,1988,1987,1986,1985,1984,1983,1982,1981,1980,1979,1978
Estas estadísticas en otros países:
AfghanistanAlbaniaAlgeriaAngolaAntigua and BarbudaArab WorldArgentinaArmeniaAustraliaAustriaAzerbaijanBahamas, TheBahrainBangladeshBarbadosBelarusBelgiumBelizeBeninBermudaBhutanBoliviaBosnia and HerzegovinaBotswanaBrazilBrunei DarussalamBulgariaBurkina FasoBurundiCabo VerdeCambodiaCameroonCanadaCaribbean small statesCentral African RepublicCentral Europe and the BalticsChadChileChinaColombiaComorosCongo, Dem. Rep.Congo, Rep.Costa RicaCote d'IvoireCroatiaCyprusCzech RepublicDenmarkDjiboutiDominicaDominican RepublicEarly-demographic dividendEast Asia & PacificEast Asia & Pacific (excluding high income)East Asia & Pacific (IDA & IBRD countries)EcuadorEgypt, Arab Rep.El SalvadorEquatorial GuineaEritreaEstoniaEthiopiaEuro areaEurope & Central AsiaEurope & Central Asia (excluding high income)Europe & Central Asia (IDA & IBRD countries)European UnionFaroe IslandsFijiFinlandFragile and conflict affected situationsFranceGabonGambia, TheGeorgiaGermanyGhanaGreeceGrenadaGuatemalaGuineaGuinea-BissauGuyanaHaitiHeavily indebted poor countries (HIPC)High incomeHondurasHong Kong SAR, ChinaHungaryIBRD onlyIcelandIDA & IBRD totalIDA blendIDA onlyIDA totalIndiaIndonesiaIran, Islamic Rep.IraqIrelandIsraelItalyJamaicaJapanJordanKazakhstanKenyaKiribatiKorea, Rep.KosovoKuwaitKyrgyz RepublicLao PDRLate-demographic dividendLatin America & Caribbean Latin America & Caribbean (excluding high income)Latin America & the Caribbean (IDA & IBRD countries)LatviaLeast developed countries: UN classificationLebanonLesothoLiberiaLibyaLithuaniaLow & middle incomeLow incomeLower middle incomeLuxembourgMacao SAR, ChinaMacedonia, FYRMadagascarMalawiMalaysiaMaldivesMaliMaltaMauritaniaMauritiusMexicoMiddle East & North AfricaMiddle East & North Africa (excluding high income)Middle East & North Africa (IDA & IBRD countries)Middle incomeMoldovaMongoliaMontenegroMoroccoMozambiqueNamibiaNepalNetherlandsNew ZealandNicaraguaNigerNigeriaNorth AmericaNorwayOECD membersOmanOther small statesPacific island small statesPakistanPanamaPapua New GuineaParaguayPeruPhilippinesPolandPortugalPost-demographic dividendPre-demographic dividendQatarRomaniaRussian FederationRwandaSaudi ArabiaSenegalSerbiaSeychellesSierra LeoneSingaporeSlovak RepublicSloveniaSmall statesSolomon IslandsSouth AfricaSouth AsiaSouth Asia (IDA & IBRD)SpainSri LankaSt. Kitts and NevisSt. LuciaSt. Vincent and the GrenadinesSub-Saharan Africa Sub-Saharan Africa (excluding high income)Sub-Saharan Africa (IDA & IBRD countries)SudanSurinameSwazilandSwedenSwitzerlandSyrian Arab RepublicTajikistanTanzaniaThailandTimor-LesteTogoTongaTrinidad and TobagoTunisiaTurkeyTurkmenistanUgandaUkraineUnited KingdomUnited StatesUpper middle incomeUruguayVanuatuVenezuela, RBVietnamWest Bank and GazaWorldYemen, Rep.ZambiaZimbabwe línea de tiempo (timeline):
En esta escala de tiempo se presenta un gráfico de 1978 y 2015 de Malawi. Los datos de 1977 están ausentes. El número de observaciones reales por fecha: 38.
Fuente (nombre):
Indicadores del desarrollo mundial
Fuente (organización):
World Bank national accounts data files.
Categorías:
Economy & Growth, Environment
Se ha actualizado:
23 abr 2017 año
Los indicadores de los cambios de valor en los últimos años
Mínimo:
1.272
1 ene 1998 año
Máximo:
22.915
1 ene 2008 año
A la fecha de observación
Valor
Cambio absoluto
El cambio con respecto al valor anterior
1 ene 1978 año
20.709
+20.709
0.0%
1 ene 1979 año
22.361
+1.652
7.98%
1 ene 1980 año
11.94
-10.421
-46.6%
1 ene 1981 año
8.534
-3.406
-28.52%
1 ene 1982 año
10.608
+2.073
24.29%
1 ene 1983 año
14.118
+3.51
33.09%
1 ene 1984 año
13.371
-0.747
-5.29%
1 ene 1985 año
13.895
+0.524
3.92%
1 ene 1986 año
11.975
-1.92
-13.82%
1 ene 1987 año
9.301
-2.674
-22.33%
1 ene 1988 año
14.527
+5.226
56.19%
1 ene 1989 año
18.496
+3.969
27.32%
1 ene 1990 año
17.174
-1.322
-7.15%
1 ene 1991 año
16.751
-0.423
-2.46%
1 ene 1992 año
17.733
+0.982
5.86%
1 ene 1993 año
5.163
-12.57
-70.88%
1 ene 1994 año
4.691
-0.472
-9.15%
1 ene 1995 año
5.67
+0.98
20.89%
1 ene 1996 año
7.768
+2.098
37.0%
1 ene 1997 año
6.719
-1.049
-13.51%
1 ene 1998 año
1.272
-5.447
-81.07%
1 ene 1999 año
13.116
+11.844
930.98%
1 ene 2000 año
4.425
-8.691
-66.27%
1 ene 2001 año
9.72
+5.296
119.68%
1 ene 2002 año
10.332
+0.612
6.29%
1 ene 2003 año
7.286
-3.046
-29.48%
1 ene 2004 año
7.058
-0.228
-3.13%
1 ene 2005 año
6.173
-0.885
-12.54%
1 ene 2006 año
3.089
-3.084
-49.96%
1 ene 2007 año
9.741
+6.652
215.38%
1 ene 2008 año
22.915
+13.174
135.24%
1 ene 2009 año
14.728
-8.187
-35.73%
1 ene 2010 año
19.64
+4.913
33.36%
1 ene 2011 año
20.704
+1.063
5.41%
1 ene 2012 año
12.428
-8.276
-39.97%
1 ene 2013 año
10.416
-2.012
-16.19%
1 ene 2014 año
14.708
+4.292
41.2%
1 ene 2015 año
15.888
+1.18
8.02%
Ranking de los países por los datos estadísticos actuales


Comentarios: