29
/es/
es
AIzaSyAYiBZKx7MnpbEhh9jyipgxe19OcubqV5w
April 1, 2024
26268
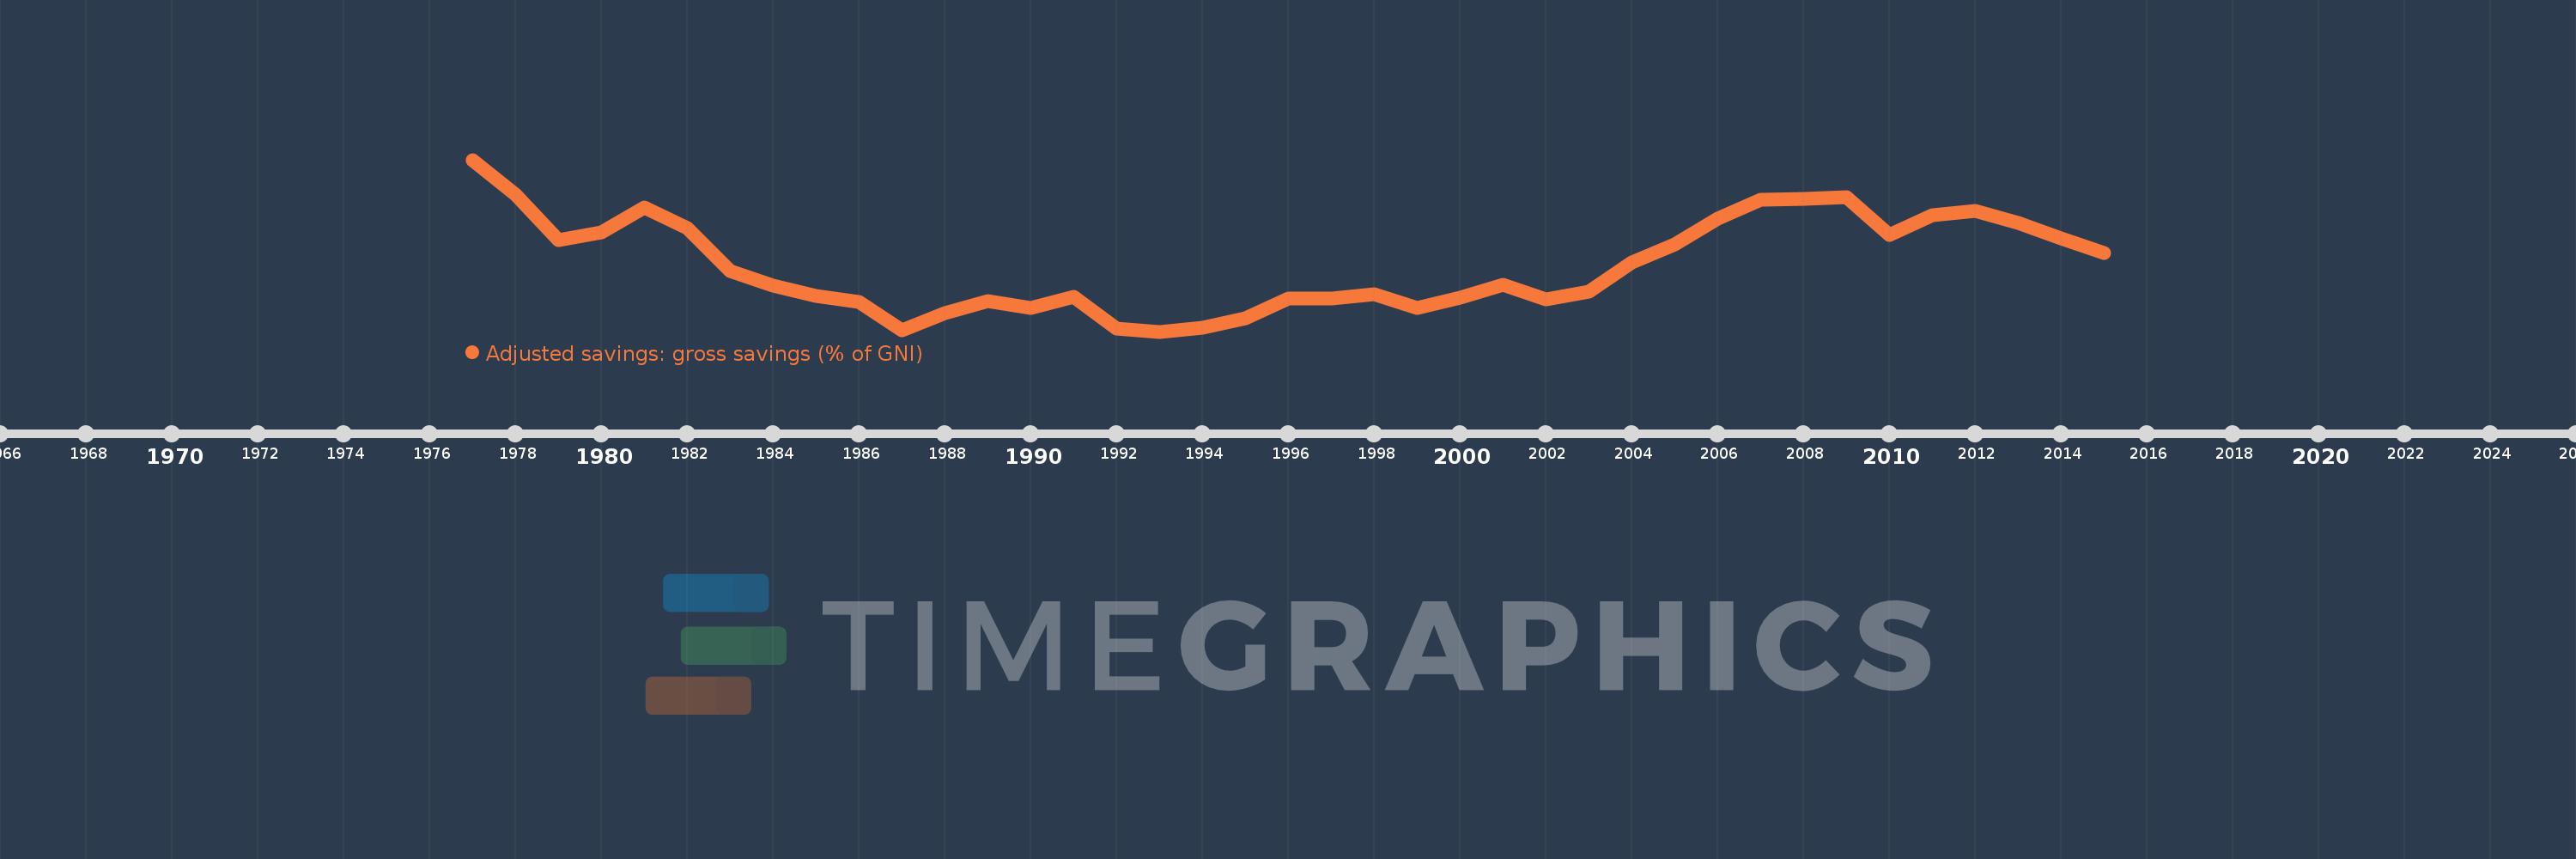
Early-demographic dividend
EAR
false
2
1
Adjusted savings: gross savings (% of GNI)
2015,2014,2013,2012,2011,2010,2009,2008,2007,2006,2005,2004,2003,2002,2001,2000,1999,1998,1997,1996,1995,1994,1993,1992,1991,1990,1989,1988,1987,1986,1985,1984,1983,1982,1981,1980,1979,1978,1977
Estas estadísticas en otros países:
AfghanistanAlbaniaAlgeriaAngolaAntigua and BarbudaArab WorldArgentinaArmeniaAustraliaAustriaAzerbaijanBahamas, TheBahrainBangladeshBarbadosBelarusBelgiumBelizeBeninBermudaBhutanBoliviaBosnia and HerzegovinaBotswanaBrazilBrunei DarussalamBulgariaBurkina FasoBurundiCabo VerdeCambodiaCameroonCanadaCaribbean small statesCentral African RepublicCentral Europe and the BalticsChadChileChinaColombiaComorosCongo, Dem. Rep.Congo, Rep.Costa RicaCote d'IvoireCroatiaCyprusCzech RepublicDenmarkDjiboutiDominicaDominican RepublicEarly-demographic dividendEast Asia & PacificEast Asia & Pacific (excluding high income)East Asia & Pacific (IDA & IBRD countries)EcuadorEgypt, Arab Rep.El SalvadorEquatorial GuineaEritreaEstoniaEthiopiaEuro areaEurope & Central AsiaEurope & Central Asia (excluding high income)Europe & Central Asia (IDA & IBRD countries)European UnionFaroe IslandsFijiFinlandFragile and conflict affected situationsFranceGabonGambia, TheGeorgiaGermanyGhanaGreeceGrenadaGuatemalaGuineaGuinea-BissauGuyanaHaitiHeavily indebted poor countries (HIPC)High incomeHondurasHong Kong SAR, ChinaHungaryIBRD onlyIcelandIDA & IBRD totalIDA blendIDA onlyIDA totalIndiaIndonesiaIran, Islamic Rep.IraqIrelandIsraelItalyJamaicaJapanJordanKazakhstanKenyaKiribatiKorea, Rep.KosovoKuwaitKyrgyz RepublicLao PDRLate-demographic dividendLatin America & Caribbean Latin America & Caribbean (excluding high income)Latin America & the Caribbean (IDA & IBRD countries)LatviaLeast developed countries: UN classificationLebanonLesothoLiberiaLibyaLithuaniaLow & middle incomeLow incomeLower middle incomeLuxembourgMacao SAR, ChinaMacedonia, FYRMadagascarMalawiMalaysiaMaldivesMaliMaltaMauritaniaMauritiusMexicoMiddle East & North AfricaMiddle East & North Africa (excluding high income)Middle East & North Africa (IDA & IBRD countries)Middle incomeMoldovaMongoliaMontenegroMoroccoMozambiqueNamibiaNepalNetherlandsNew ZealandNicaraguaNigerNigeriaNorth AmericaNorwayOECD membersOmanOther small statesPacific island small statesPakistanPanamaPapua New GuineaParaguayPeruPhilippinesPolandPortugalPost-demographic dividendPre-demographic dividendQatarRomaniaRussian FederationRwandaSaudi ArabiaSenegalSerbiaSeychellesSierra LeoneSingaporeSlovak RepublicSloveniaSmall statesSolomon IslandsSouth AfricaSouth AsiaSouth Asia (IDA & IBRD)SpainSri LankaSt. Kitts and NevisSt. LuciaSt. Vincent and the GrenadinesSub-Saharan Africa Sub-Saharan Africa (excluding high income)Sub-Saharan Africa (IDA & IBRD countries)SudanSurinameSwazilandSwedenSwitzerlandSyrian Arab RepublicTajikistanTanzaniaThailandTimor-LesteTogoTongaTrinidad and TobagoTunisiaTurkeyTurkmenistanUgandaUkraineUnited KingdomUnited StatesUpper middle incomeUruguayVanuatuVenezuela, RBVietnamWest Bank and GazaWorldYemen, Rep.ZambiaZimbabwe línea de tiempo (timeline):
En esta escala de tiempo se presenta un gráfico de 1977 y 2015 de Early-demographic dividend. Los datos de 1976 están ausentes. El número de observaciones reales por fecha: 39.
Fuente (nombre):
Indicadores del desarrollo mundial
Fuente (organización):
World Bank national accounts data files.
Categorías:
Economy & Growth, Environment
Se ha actualizado:
23 abr 2017 año
Los indicadores de los cambios de valor en los últimos años
Mínimo:
19.26
1 ene 1993 año
Máximo:
32.361
1 ene 1977 año
A la fecha de observación
Valor
Cambio absoluto
El cambio con respecto al valor anterior
1 ene 1977 año
32.361
+32.361
0.0%
1 ene 1978 año
29.684
-2.677
-8.27%
1 ene 1979 año
26.259
-3.425
-11.54%
1 ene 1980 año
26.834
+0.575
2.19%
1 ene 1981 año
28.743
+1.909
7.11%
1 ene 1982 año
27.167
-1.576
-5.48%
1 ene 1983 año
23.881
-3.286
-12.1%
1 ene 1984 año
22.76
-1.121
-4.69%
1 ene 1985 año
21.967
-0.793
-3.48%
1 ene 1986 año
21.538
-0.428
-1.95%
1 ene 1987 año
19.368
-2.171
-10.08%
1 ene 1988 año
20.661
+1.293
6.68%
1 ene 1989 año
21.574
+0.914
4.42%
1 ene 1990 año
21.05
-0.524
-2.43%
1 ene 1991 año
21.886
+0.836
3.97%
1 ene 1992 año
19.495
-2.39
-10.92%
1 ene 1993 año
19.26
-0.235
-1.21%
1 ene 1994 año
19.537
+0.276
1.44%
1 ene 1995 año
20.308
+0.771
3.95%
1 ene 1996 año
21.773
+1.465
7.21%
1 ene 1997 año
21.797
+0.024
0.11%
1 ene 1998 año
22.116
+0.32
1.47%
1 ene 1999 año
21.044
-1.072
-4.85%
1 ene 2000 año
21.85
+0.806
3.83%
1 ene 2001 año
22.805
+0.955
4.37%
1 ene 2002 año
21.694
-1.111
-4.87%
1 ene 2003 año
22.321
+0.628
2.89%
1 ene 2004 año
24.516
+2.194
9.83%
1 ene 2005 año
25.906
+1.39
5.67%
1 ene 2006 año
27.847
+1.941
7.49%
1 ene 2007 año
29.303
+1.456
5.23%
1 ene 2008 año
29.413
+0.11
0.37%
1 ene 2009 año
29.525
+0.113
0.38%
1 ene 2010 año
26.597
-2.928
-9.92%
1 ene 2011 año
28.112
+1.515
5.69%
1 ene 2012 año
28.453
+0.342
1.22%
1 ene 2013 año
27.531
-0.923
-3.24%
1 ene 2014 año
26.386
-1.144
-4.16%
1 ene 2015 año
25.241
-1.146
-4.34%
Ranking de los países por los datos estadísticos actuales


Comentarios: