29
/es/
es
AIzaSyAYiBZKx7MnpbEhh9jyipgxe19OcubqV5w
April 1, 2024
62254
Upper middle income
UMC
false
2
1
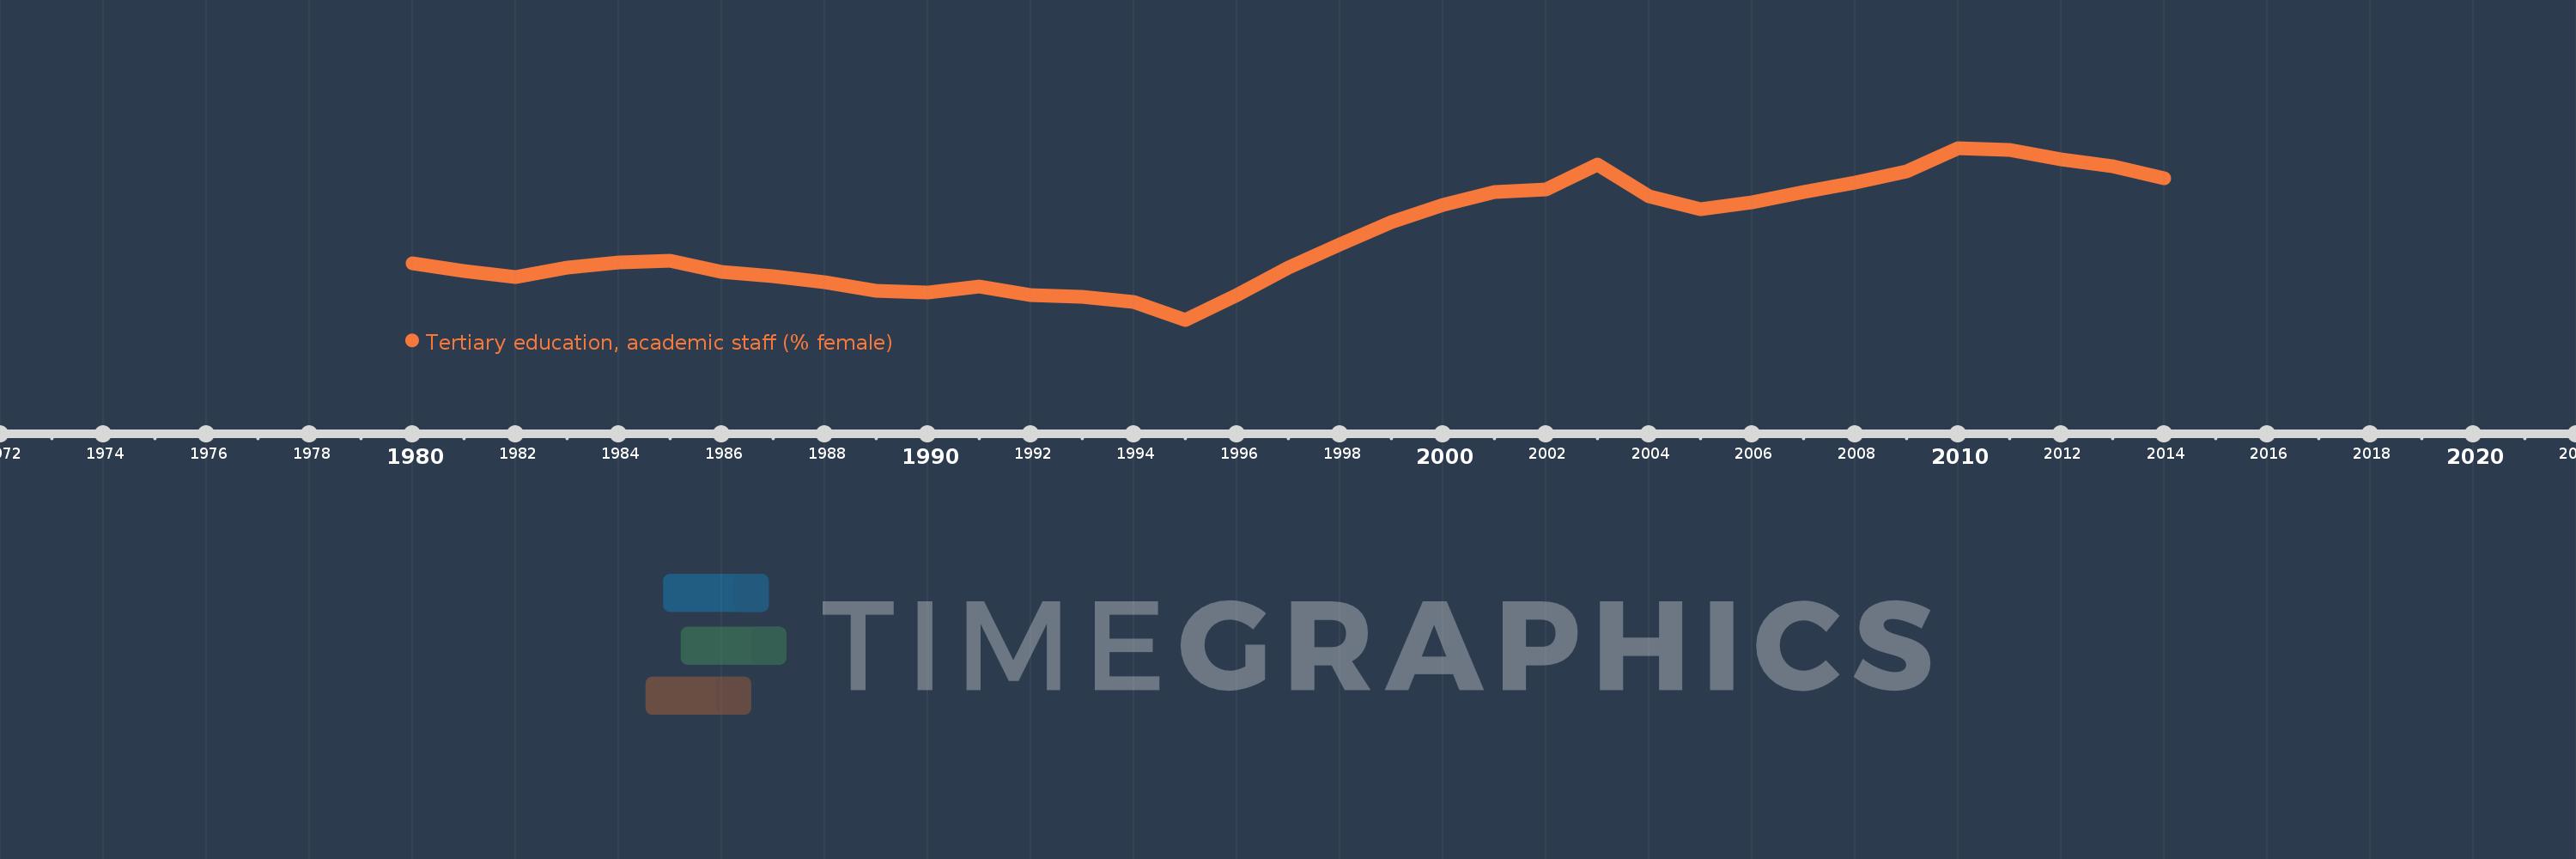
Tertiary education, academic staff (% female)
2014,2013,2012,2011,2010,2009,2008,2007,2006,2005,2004,2003,2002,2001,2000,1999,1998,1997,1996,1995,1994,1993,1992,1991,1990,1989,1988,1987,1986,1985,1984,1983,1982,1981,1980
Estas estadísticas en otros países:
AfghanistanAlbaniaAlgeriaAndorraAngolaAntigua and BarbudaArab WorldArgentinaArmeniaArubaAustraliaAustriaAzerbaijanBahamas, TheBahrainBangladeshBarbadosBelarusBelgiumBelizeBeninBermudaBhutanBoliviaBosnia and HerzegovinaBotswanaBrazilBritish Virgin IslandsBrunei DarussalamBulgariaBurkina FasoBurundiCabo VerdeCambodiaCameroonCanadaCaribbean small statesCayman IslandsCentral African RepublicCentral Europe and the BalticsChadChileChinaColombiaComorosCongo, Dem. Rep.Congo, Rep.Costa RicaCote d'IvoireCroatiaCubaCyprusCzech RepublicDenmarkDjiboutiDominicaDominican RepublicEarly-demographic dividendEast Asia & PacificEast Asia & Pacific (excluding high income)East Asia & Pacific (IDA & IBRD countries)EcuadorEgypt, Arab Rep.El SalvadorEquatorial GuineaEritreaEstoniaEthiopiaEuro areaEurope & Central AsiaEurope & Central Asia (excluding high income)Europe & Central Asia (IDA & IBRD countries)European UnionFijiFinlandFragile and conflict affected situationsFranceGabonGambia, TheGeorgiaGermanyGhanaGreeceGrenadaGuineaGuyanaHaitiHeavily indebted poor countries (HIPC)High incomeHondurasHong Kong SAR, ChinaHungaryIBRD onlyIcelandIDA & IBRD totalIDA blendIDA onlyIDA totalIndiaIndonesiaIran, Islamic Rep.IraqIrelandItalyJamaicaJapanJordanKazakhstanKorea, Dem. People’s Rep.Korea, Rep.KuwaitKyrgyz RepublicLao PDRLate-demographic dividendLatin America & Caribbean Latin America & Caribbean (excluding high income)Latin America & the Caribbean (IDA & IBRD countries)LatviaLeast developed countries: UN classificationLebanonLesothoLiberiaLibyaLiechtensteinLithuaniaLow & middle incomeLow incomeLower middle incomeLuxembourgMacao SAR, ChinaMacedonia, FYRMadagascarMalawiMalaysiaMaldivesMaliMaltaMarshall IslandsMauritaniaMauritiusMicronesia, Fed. Sts.Middle East & North AfricaMiddle East & North Africa (excluding high income)Middle East & North Africa (IDA & IBRD countries)Middle incomeMoldovaMongoliaMoroccoMozambiqueMyanmarNamibiaNepalNetherlandsNew ZealandNicaraguaNigerNigeriaNorth AmericaNorwayOECD membersOmanOther small statesPacific island small statesPakistanPalauPanamaPapua New GuineaPeruPhilippinesPolandPortugalPost-demographic dividendPre-demographic dividendPuerto RicoQatarRomaniaRussian FederationRwandaSamoaSao Tome and PrincipeSaudi ArabiaSenegalSerbiaSeychellesSierra LeoneSingaporeSint Maarten (Dutch part)Slovak RepublicSloveniaSmall statesSomaliaSouth AfricaSouth AsiaSouth Asia (IDA & IBRD)SpainSri LankaSt. Kitts and NevisSt. LuciaSt. Vincent and the GrenadinesSub-Saharan Africa Sub-Saharan Africa (excluding high income)Sub-Saharan Africa (IDA & IBRD countries)SudanSurinameSwazilandSwedenSwitzerlandSyrian Arab RepublicTajikistanTanzaniaThailandTimor-LesteTogoTongaTrinidad and TobagoTunisiaTurkeyTurkmenistanUgandaUnited Arab EmiratesUnited KingdomUnited StatesUpper middle incomeUruguayUzbekistanVenezuela, RBVietnamWest Bank and GazaWorldYemen, Rep.Zimbabwe línea de tiempo (timeline):
En esta escala de tiempo se presenta un gráfico de 1980 y 2014 de Upper middle income. Los datos de 1979 están ausentes. El número de observaciones reales por fecha: 35.
Fuente (nombre):
Indicadores del desarrollo mundial
Fuente (organización):
United Nations Educational, Scientific, and Cultural Organization (UNESCO) Institute for Statistics.
Categorías:
Education
Se ha actualizado:
23 abr 2017 año
Los indicadores de los cambios de valor en los últimos años
Mínimo:
38.663
1 ene 1995 año
Máximo:
45.886
1 ene 2010 año
A la fecha de observación
Valor
Cambio absoluto
El cambio con respecto al valor anterior
1 ene 1980 año
41.047
+41.047
0.0%
1 ene 1981 año
40.722
-0.326
-0.79%
1 ene 1982 año
40.471
-0.251
-0.62%
1 ene 1983 año
40.871
+0.4
0.99%
1 ene 1984 año
41.059
+0.188
0.46%
1 ene 1985 año
41.149
+0.09
0.22%
1 ene 1986 año
40.673
-0.476
-1.16%
1 ene 1987 año
40.49
-0.183
-0.45%
1 ene 1988 año
40.243
-0.247
-0.61%
1 ene 1989 año
39.881
-0.362
-0.9%
1 ene 1990 año
39.809
-0.072
-0.18%
1 ene 1991 año
40.067
+0.258
0.65%
1 ene 1992 año
39.695
-0.372
-0.93%
1 ene 1993 año
39.635
-0.06
-0.15%
1 ene 1994 año
39.403
-0.232
-0.58%
1 ene 1995 año
38.663
-0.74
-1.88%
1 ene 1996 año
39.709
+1.046
2.7%
1 ene 1997 año
40.861
+1.152
2.9%
1 ene 1998 año
41.826
+0.965
2.36%
1 ene 1999 año
42.783
+0.957
2.29%
1 ene 2000 año
43.505
+0.722
1.69%
1 ene 2001 año
44.051
+0.546
1.25%
1 ene 2002 año
44.145
+0.094
0.21%
1 ene 2003 año
45.184
+1.039
2.35%
1 ene 2004 año
43.87
-1.314
-2.91%
1 ene 2005 año
43.312
-0.558
-1.27%
1 ene 2006 año
43.606
+0.294
0.68%
1 ene 2007 año
44.032
+0.426
0.98%
1 ene 2008 año
44.416
+0.384
0.87%
1 ene 2009 año
44.899
+0.483
1.09%
1 ene 2010 año
45.886
+0.987
2.2%
1 ene 2011 año
45.801
-0.085
-0.18%
1 ene 2012 año
45.395
-0.406
-0.89%
1 ene 2013 año
45.122
-0.273
-0.6%
1 ene 2014 año
44.621
-0.502
-1.11%
Ranking de los países por los datos estadísticos actuales


Comentarios: