29
/es/
es
AIzaSyAYiBZKx7MnpbEhh9jyipgxe19OcubqV5w
April 1, 2024
50501
Middle East & North Africa (IDA & IBRD countries)
TMN
false
2
1
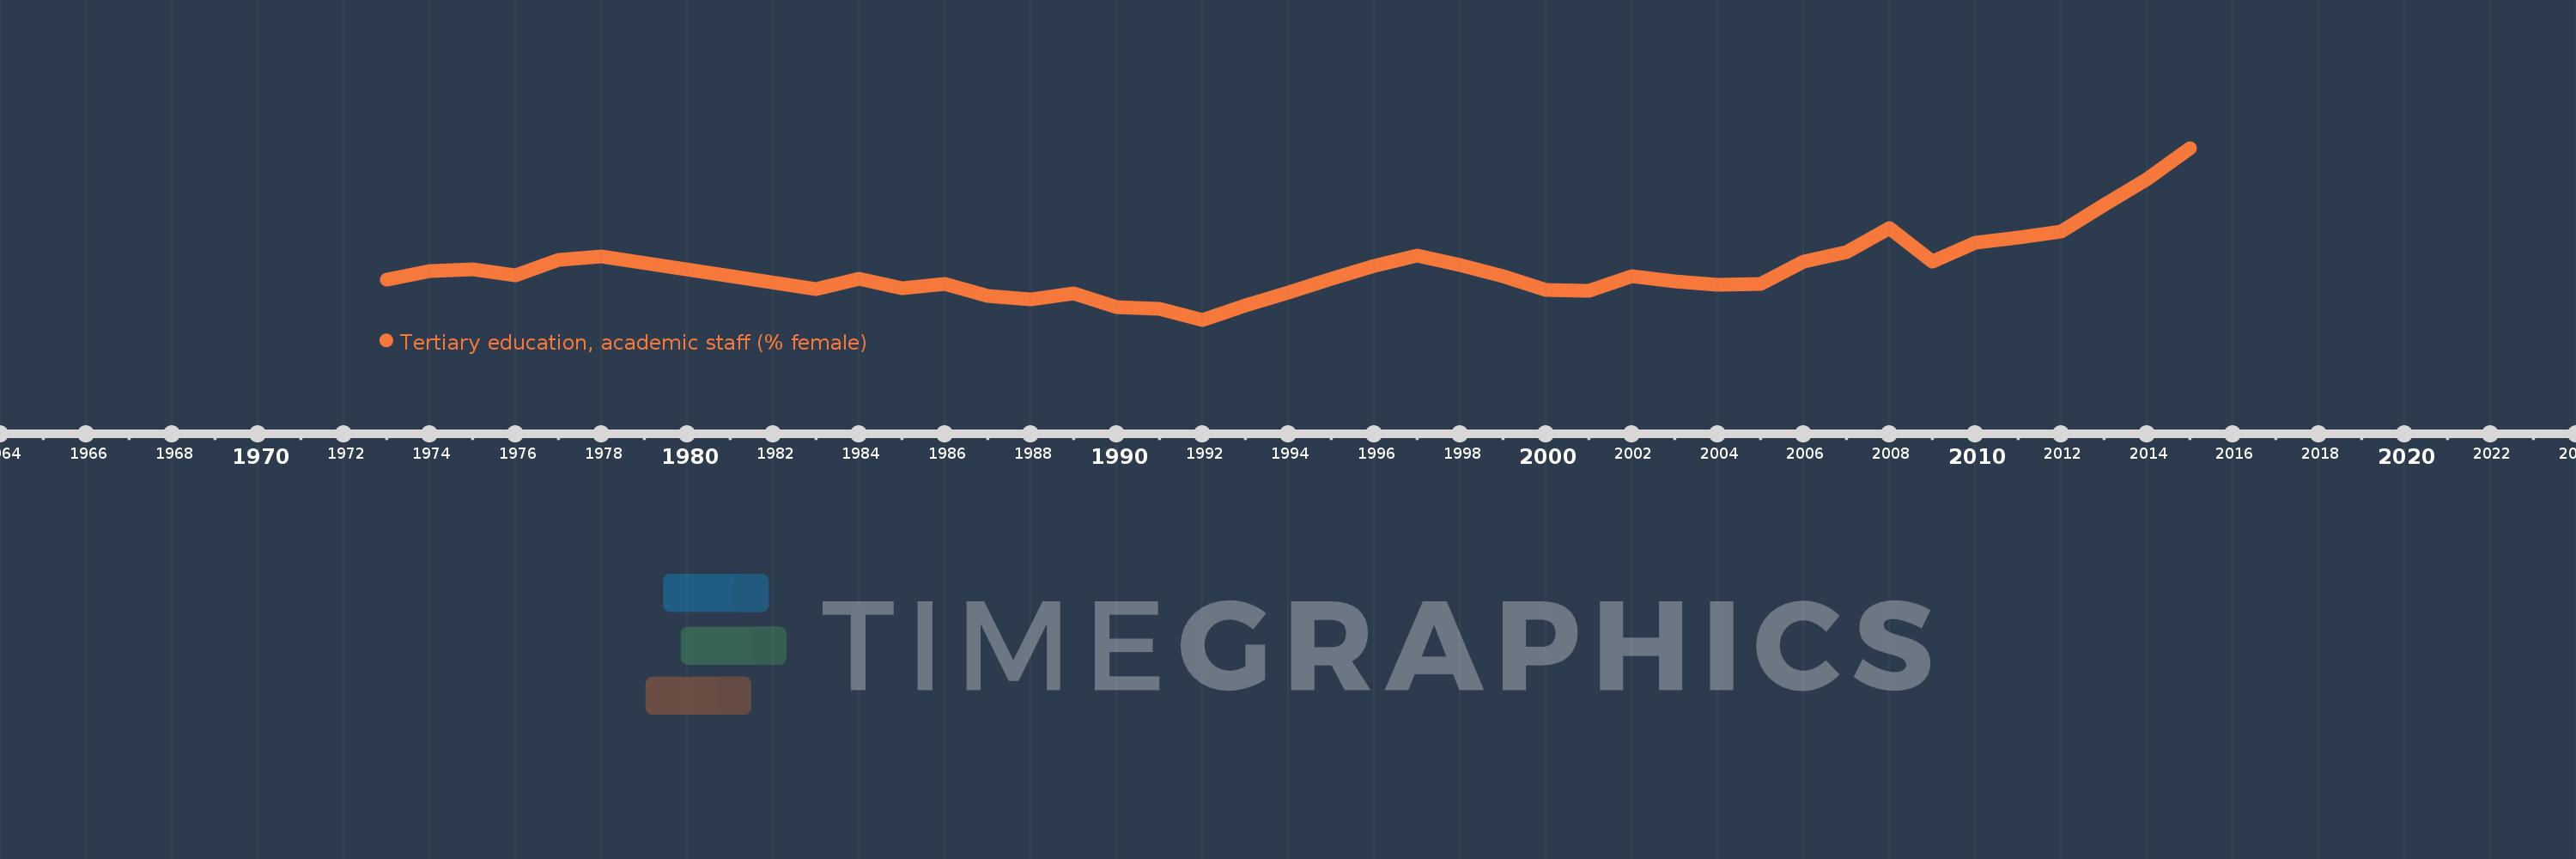
Tertiary education, academic staff (% female)
2015,2014,2013,2012,2011,2010,2009,2008,2007,2006,2005,2004,2003,2002,2001,2000,1999,1998,1997,1996,1995,1994,1993,1992,1991,1990,1989,1988,1987,1986,1985,1984,1983,1978,1977,1976,1975,1974,1973
Estas estadísticas en otros países:
AfghanistanAlbaniaAlgeriaAndorraAngolaAntigua and BarbudaArab WorldArgentinaArmeniaArubaAustraliaAustriaAzerbaijanBahamas, TheBahrainBangladeshBarbadosBelarusBelgiumBelizeBeninBermudaBhutanBoliviaBosnia and HerzegovinaBotswanaBrazilBritish Virgin IslandsBrunei DarussalamBulgariaBurkina FasoBurundiCabo VerdeCambodiaCameroonCanadaCaribbean small statesCayman IslandsCentral African RepublicCentral Europe and the BalticsChadChileChinaColombiaComorosCongo, Dem. Rep.Congo, Rep.Costa RicaCote d'IvoireCroatiaCubaCyprusCzech RepublicDenmarkDjiboutiDominicaDominican RepublicEarly-demographic dividendEast Asia & PacificEast Asia & Pacific (excluding high income)East Asia & Pacific (IDA & IBRD countries)EcuadorEgypt, Arab Rep.El SalvadorEquatorial GuineaEritreaEstoniaEthiopiaEuro areaEurope & Central AsiaEurope & Central Asia (excluding high income)Europe & Central Asia (IDA & IBRD countries)European UnionFijiFinlandFragile and conflict affected situationsFranceGabonGambia, TheGeorgiaGermanyGhanaGreeceGrenadaGuineaGuyanaHaitiHeavily indebted poor countries (HIPC)High incomeHondurasHong Kong SAR, ChinaHungaryIBRD onlyIcelandIDA & IBRD totalIDA blendIDA onlyIDA totalIndiaIndonesiaIran, Islamic Rep.IraqIrelandItalyJamaicaJapanJordanKazakhstanKorea, Dem. People’s Rep.Korea, Rep.KuwaitKyrgyz RepublicLao PDRLate-demographic dividendLatin America & Caribbean Latin America & Caribbean (excluding high income)Latin America & the Caribbean (IDA & IBRD countries)LatviaLeast developed countries: UN classificationLebanonLesothoLiberiaLibyaLiechtensteinLithuaniaLow & middle incomeLow incomeLower middle incomeLuxembourgMacao SAR, ChinaMacedonia, FYRMadagascarMalawiMalaysiaMaldivesMaliMaltaMarshall IslandsMauritaniaMauritiusMicronesia, Fed. Sts.Middle East & North AfricaMiddle East & North Africa (excluding high income)Middle East & North Africa (IDA & IBRD countries)Middle incomeMoldovaMongoliaMoroccoMozambiqueMyanmarNamibiaNepalNetherlandsNew ZealandNicaraguaNigerNigeriaNorth AmericaNorwayOECD membersOmanOther small statesPacific island small statesPakistanPalauPanamaPapua New GuineaPeruPhilippinesPolandPortugalPost-demographic dividendPre-demographic dividendPuerto RicoQatarRomaniaRussian FederationRwandaSamoaSao Tome and PrincipeSaudi ArabiaSenegalSerbiaSeychellesSierra LeoneSingaporeSint Maarten (Dutch part)Slovak RepublicSloveniaSmall statesSomaliaSouth AfricaSouth AsiaSouth Asia (IDA & IBRD)SpainSri LankaSt. Kitts and NevisSt. LuciaSt. Vincent and the GrenadinesSub-Saharan Africa Sub-Saharan Africa (excluding high income)Sub-Saharan Africa (IDA & IBRD countries)SudanSurinameSwazilandSwedenSwitzerlandSyrian Arab RepublicTajikistanTanzaniaThailandTimor-LesteTogoTongaTrinidad and TobagoTunisiaTurkeyTurkmenistanUgandaUnited Arab EmiratesUnited KingdomUnited StatesUpper middle incomeUruguayUzbekistanVenezuela, RBVietnamWest Bank and GazaWorldYemen, Rep.Zimbabwe línea de tiempo (timeline):
En esta escala de tiempo se presenta un gráfico de 1973 y 2015 de Middle East & North Africa (IDA & IBRD countries). Los datos de 1972 están ausentes. El número de observaciones reales por fecha: 39.
Fuente (nombre):
Indicadores del desarrollo mundial
Fuente (organización):
United Nations Educational, Scientific, and Cultural Organization (UNESCO) Institute for Statistics.
Categorías:
Education
Se ha actualizado:
23 abr 2017 año
Los indicadores de los cambios de valor en los últimos años
Mínimo:
26.446
1 ene 1992 año
Máximo:
34.144
1 ene 2015 año
A la fecha de observación
Valor
Cambio absoluto
El cambio con respecto al valor anterior
1 ene 1973 año
28.245
+28.245
0.0%
1 ene 1974 año
28.611
+0.366
1.3%
1 ene 1975 año
28.717
+0.106
0.37%
1 ene 1976 año
28.426
-0.291
-1.01%
1 ene 1977 año
29.129
+0.703
2.47%
1 ene 1978 año
29.296
+0.167
0.57%
1 ene 1983 año
27.831
-1.465
-5.0%
1 ene 1984 año
28.27
+0.439
1.58%
1 ene 1985 año
27.877
-0.394
-1.39%
1 ene 1986 año
28.047
+0.17
0.61%
1 ene 1987 año
27.504
-0.543
-1.94%
1 ene 1988 año
27.369
-0.135
-0.49%
1 ene 1989 año
27.632
+0.263
0.96%
1 ene 1990 año
27.018
-0.614
-2.22%
1 ene 1991 año
26.935
-0.083
-0.31%
1 ene 1992 año
26.446
-0.489
-1.82%
1 ene 1993 año
27.095
+0.649
2.46%
1 ene 1994 año
27.663
+0.568
2.1%
1 ene 1995 año
28.301
+0.638
2.31%
1 ene 1996 año
28.859
+0.558
1.97%
1 ene 1997 año
29.314
+0.455
1.58%
1 ene 1998 año
28.879
-0.435
-1.48%
1 ene 1999 año
28.416
-0.463
-1.6%
1 ene 2000 año
27.797
-0.62
-2.18%
1 ene 2001 año
27.741
-0.055
-0.2%
1 ene 2002 año
28.404
+0.663
2.39%
1 ene 2003 año
28.179
-0.225
-0.79%
1 ene 2004 año
28.016
-0.163
-0.58%
1 ene 2005 año
28.044
+0.027
0.1%
1 ene 2006 año
29.045
+1.001
3.57%
1 ene 2007 año
29.474
+0.429
1.48%
1 ene 2008 año
30.562
+1.088
3.69%
1 ene 2009 año
29.065
-1.497
-4.9%
1 ene 2010 año
29.896
+0.831
2.86%
1 ene 2011 año
30.144
+0.249
0.83%
1 ene 2012 año
30.412
+0.267
0.89%
1 ene 2013 año
31.586
+1.174
3.86%
1 ene 2014 año
32.753
+1.167
3.69%
1 ene 2015 año
34.144
+1.391
4.25%
Ranking de los países por los datos estadísticos actuales


Comentarios: