29
/es/
es
AIzaSyAYiBZKx7MnpbEhh9jyipgxe19OcubqV5w
April 1, 2024
153152
Hungary
HUN
true
2
1
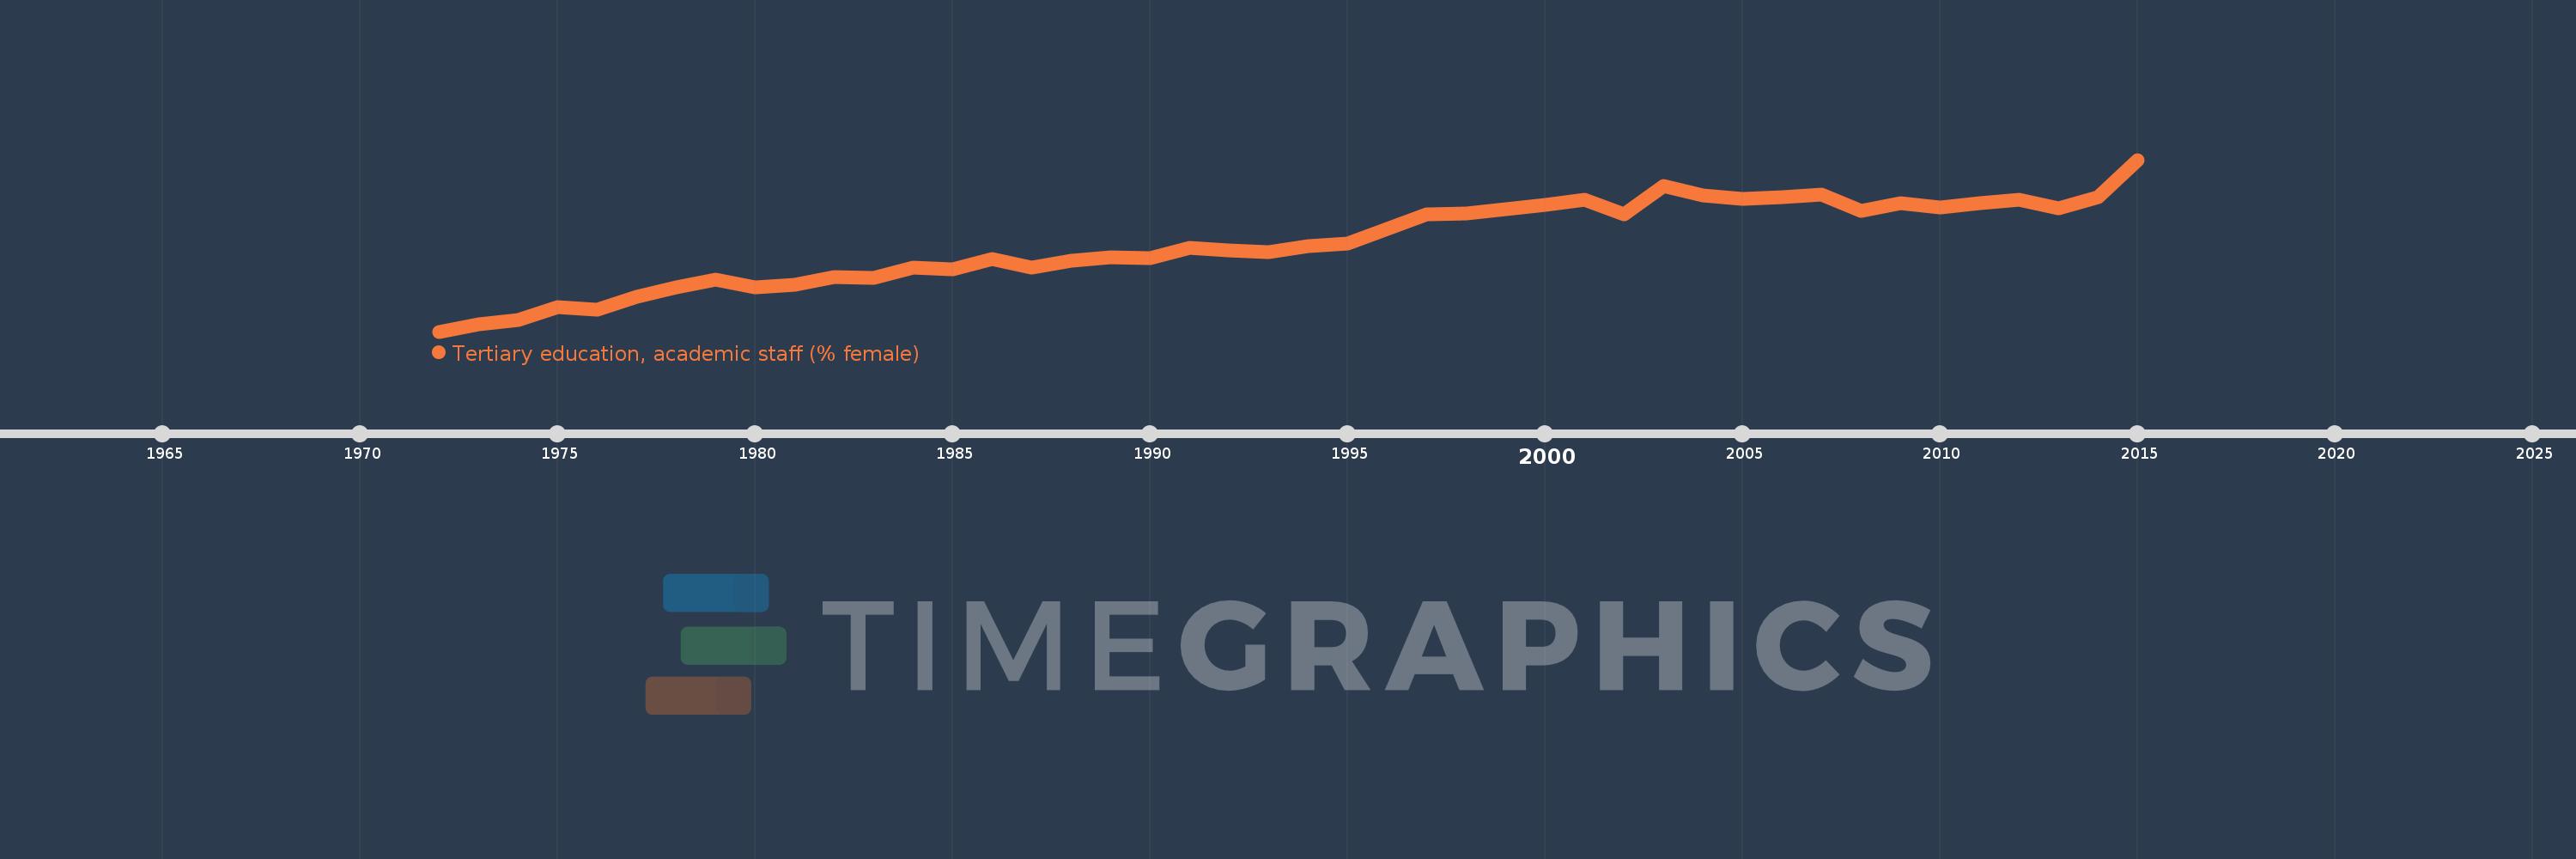
Tertiary education, academic staff (% female)
2015,2014,2013,2012,2011,2010,2009,2008,2007,2006,2005,2004,2003,2002,2001,2000,1998,1997,1995,1994,1993,1992,1991,1990,1989,1988,1987,1986,1985,1984,1983,1982,1981,1980,1979,1978,1977,1976,1975,1974,1973,1972
Estas estadísticas en otros países:
AfghanistanAlbaniaAlgeriaAndorraAngolaAntigua and BarbudaArab WorldArgentinaArmeniaArubaAustraliaAustriaAzerbaijanBahamas, TheBahrainBangladeshBarbadosBelarusBelgiumBelizeBeninBermudaBhutanBoliviaBosnia and HerzegovinaBotswanaBrazilBritish Virgin IslandsBrunei DarussalamBulgariaBurkina FasoBurundiCabo VerdeCambodiaCameroonCanadaCaribbean small statesCayman IslandsCentral African RepublicCentral Europe and the BalticsChadChileChinaColombiaComorosCongo, Dem. Rep.Congo, Rep.Costa RicaCote d'IvoireCroatiaCubaCyprusCzech RepublicDenmarkDjiboutiDominicaDominican RepublicEarly-demographic dividendEast Asia & PacificEast Asia & Pacific (excluding high income)East Asia & Pacific (IDA & IBRD countries)EcuadorEgypt, Arab Rep.El SalvadorEquatorial GuineaEritreaEstoniaEthiopiaEuro areaEurope & Central AsiaEurope & Central Asia (excluding high income)Europe & Central Asia (IDA & IBRD countries)European UnionFijiFinlandFragile and conflict affected situationsFranceGabonGambia, TheGeorgiaGermanyGhanaGreeceGrenadaGuineaGuyanaHaitiHeavily indebted poor countries (HIPC)High incomeHondurasHong Kong SAR, ChinaHungaryIBRD onlyIcelandIDA & IBRD totalIDA blendIDA onlyIDA totalIndiaIndonesiaIran, Islamic Rep.IraqIrelandItalyJamaicaJapanJordanKazakhstanKorea, Dem. People’s Rep.Korea, Rep.KuwaitKyrgyz RepublicLao PDRLate-demographic dividendLatin America & Caribbean Latin America & Caribbean (excluding high income)Latin America & the Caribbean (IDA & IBRD countries)LatviaLeast developed countries: UN classificationLebanonLesothoLiberiaLibyaLiechtensteinLithuaniaLow & middle incomeLow incomeLower middle incomeLuxembourgMacao SAR, ChinaMacedonia, FYRMadagascarMalawiMalaysiaMaldivesMaliMaltaMarshall IslandsMauritaniaMauritiusMicronesia, Fed. Sts.Middle East & North AfricaMiddle East & North Africa (excluding high income)Middle East & North Africa (IDA & IBRD countries)Middle incomeMoldovaMongoliaMoroccoMozambiqueMyanmarNamibiaNepalNetherlandsNew ZealandNicaraguaNigerNigeriaNorth AmericaNorwayOECD membersOmanOther small statesPacific island small statesPakistanPalauPanamaPapua New GuineaPeruPhilippinesPolandPortugalPost-demographic dividendPre-demographic dividendPuerto RicoQatarRomaniaRussian FederationRwandaSamoaSao Tome and PrincipeSaudi ArabiaSenegalSerbiaSeychellesSierra LeoneSingaporeSint Maarten (Dutch part)Slovak RepublicSloveniaSmall statesSomaliaSouth AfricaSouth AsiaSouth Asia (IDA & IBRD)SpainSri LankaSt. Kitts and NevisSt. LuciaSt. Vincent and the GrenadinesSub-Saharan Africa Sub-Saharan Africa (excluding high income)Sub-Saharan Africa (IDA & IBRD countries)SudanSurinameSwazilandSwedenSwitzerlandSyrian Arab RepublicTajikistanTanzaniaThailandTimor-LesteTogoTongaTrinidad and TobagoTunisiaTurkeyTurkmenistanUgandaUnited Arab EmiratesUnited KingdomUnited StatesUpper middle incomeUruguayUzbekistanVenezuela, RBVietnamWest Bank and GazaWorldYemen, Rep.Zimbabwe línea de tiempo (timeline):
En esta escala de tiempo se presenta un gráfico de 1972 y 2015 de Hungary. Los datos de 1971 están ausentes. El número de observaciones reales por fecha: 42.
Fuente (nombre):
Indicadores del desarrollo mundial
Fuente (organización):
United Nations Educational, Scientific, and Cultural Organization (UNESCO) Institute for Statistics.
Categorías:
Education
Se ha actualizado:
23 abr 2017 año
Los indicadores de los cambios de valor en los últimos años
Mínimo:
22.47
1 ene 1972 año
Máximo:
43.314
1 ene 2015 año
A la fecha de observación
Valor
Cambio absoluto
El cambio con respecto al valor anterior
1 ene 1972 año
22.47
+22.47
0.0%
1 ene 1973 año
23.332
+0.862
3.84%
1 ene 1974 año
23.845
+0.513
2.2%
1 ene 1975 año
25.426
+1.581
6.63%
1 ene 1976 año
25.164
-0.262
-1.03%
1 ene 1977 año
26.733
+1.569
6.23%
1 ene 1978 año
27.851
+1.118
4.18%
1 ene 1979 año
28.77
+0.919
3.3%
1 ene 1980 año
27.807
-0.963
-3.35%
1 ene 1981 año
28.175
+0.369
1.33%
1 ene 1982 año
29.129
+0.954
3.38%
1 ene 1983 año
28.982
-0.147
-0.5%
1 ene 1984 año
30.219
+1.237
4.27%
1 ene 1985 año
30.024
-0.196
-0.65%
1 ene 1986 año
31.289
+1.266
4.22%
1 ene 1987 año
30.276
-1.013
-3.24%
1 ene 1988 año
31.03
+0.754
2.49%
1 ene 1989 año
31.473
+0.443
1.43%
1 ene 1990 año
31.41
-0.063
-0.2%
1 ene 1991 año
32.674
+1.264
4.02%
1 ene 1992 año
32.32
-0.354
-1.08%
1 ene 1993 año
32.065
-0.255
-0.79%
1 ene 1994 año
32.824
+0.759
2.37%
1 ene 1995 año
33.13
+0.306
0.93%
1 ene 1997 año
36.667
+3.537
10.68%
1 ene 1998 año
36.769
+0.102
0.28%
1 ene 2000 año
37.8
+1.031
2.8%
1 ene 2001 año
38.501
+0.701
1.85%
1 ene 2002 año
36.685
-1.815
-4.72%
1 ene 2003 año
40.129
+3.444
9.39%
1 ene 2004 año
38.965
-1.163
-2.9%
1 ene 2005 año
38.623
-0.342
-0.88%
1 ene 2006 año
38.799
+0.176
0.46%
1 ene 2007 año
39.139
+0.34
0.88%
1 ene 2008 año
37.081
-2.058
-5.26%
1 ene 2009 año
38.013
+0.932
2.51%
1 ene 2010 año
37.567
-0.446
-1.17%
1 ene 2011 año
38.075
+0.508
1.35%
1 ene 2012 año
38.49
+0.414
1.09%
1 ene 2013 año
37.469
-1.021
-2.65%
1 ene 2014 año
38.781
+1.312
3.5%
1 ene 2015 año
43.314
+4.533
11.69%
Ranking de los países por los datos estadísticos actuales


Comentarios: