29
/es/
es
AIzaSyAYiBZKx7MnpbEhh9jyipgxe19OcubqV5w
April 1, 2024
61258
Sub-Saharan Africa (IDA & IBRD countries)
TSS
false
2
1
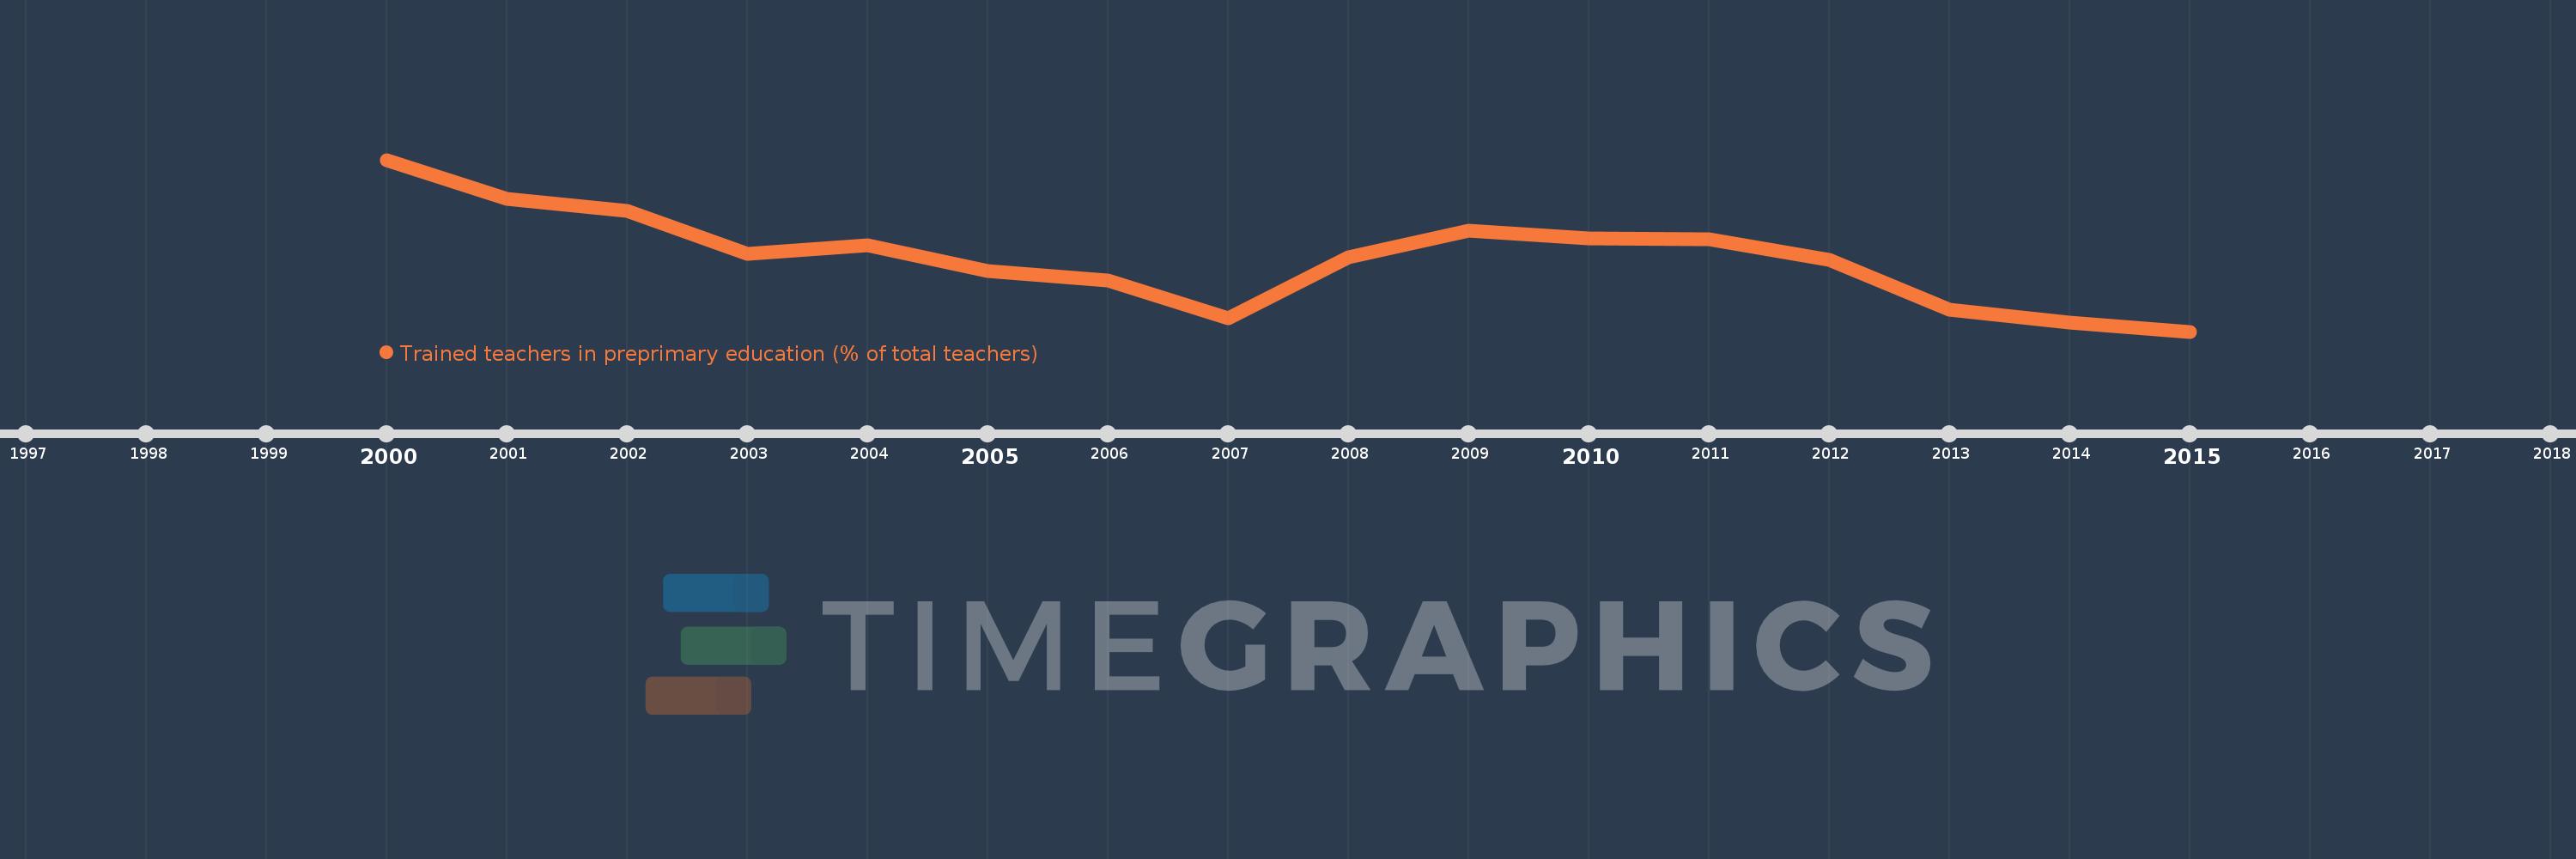
Trained teachers in preprimary education (% of total teachers)
2015,2014,2013,2012,2011,2010,2009,2008,2007,2006,2005,2004,2003,2002,2001,2000
Estas estadísticas en otros países:
línea de tiempo (timeline):
En esta escala de tiempo se presenta un gráfico de 2000 y 2015 de Sub-Saharan Africa (IDA & IBRD countries). Los datos de 1999 están ausentes. El número de observaciones reales por fecha: 16.
Fuente (nombre):
Indicadores del desarrollo mundial
Fuente (organización):
United Nations Educational, Scientific, and Cultural Organization (UNESCO) Institute for Statistics.
Categorías:
Education
Se ha actualizado:
23 abr 2017 año
Los indicadores de los cambios de valor en los últimos años
Mínimo:
45.664
1 ene 2015 año
Máximo:
60.75
1 ene 2000 año
A la fecha de observación
Valor
Cambio absoluto
El cambio con respecto al valor anterior
1 ene 2000 año
60.75
+60.75
0.0%
1 ene 2001 año
57.305
-3.445
-5.67%
1 ene 2002 año
56.225
-1.079
-1.88%
1 ene 2003 año
52.488
-3.737
-6.65%
1 ene 2004 año
53.233
+0.745
1.42%
1 ene 2005 año
50.978
-2.256
-4.24%
1 ene 2006 año
50.125
-0.852
-1.67%
1 ene 2007 año
46.801
-3.324
-6.63%
1 ene 2008 año
52.164
+5.363
11.46%
1 ene 2009 año
54.519
+2.356
4.52%
1 ene 2010 año
53.878
-0.641
-1.18%
1 ene 2011 año
53.736
-0.142
-0.26%
1 ene 2012 año
51.933
-1.803
-3.36%
1 ene 2013 año
47.604
-4.329
-8.34%
1 ene 2014 año
46.427
-1.176
-2.47%
1 ene 2015 año
45.664
-0.764
-1.64%
Ranking de los países por los datos estadísticos actuales


Comentarios: