29
/es/
es
AIzaSyAYiBZKx7MnpbEhh9jyipgxe19OcubqV5w
April 1, 2024
207548
Nepal
NPL
true
2
1
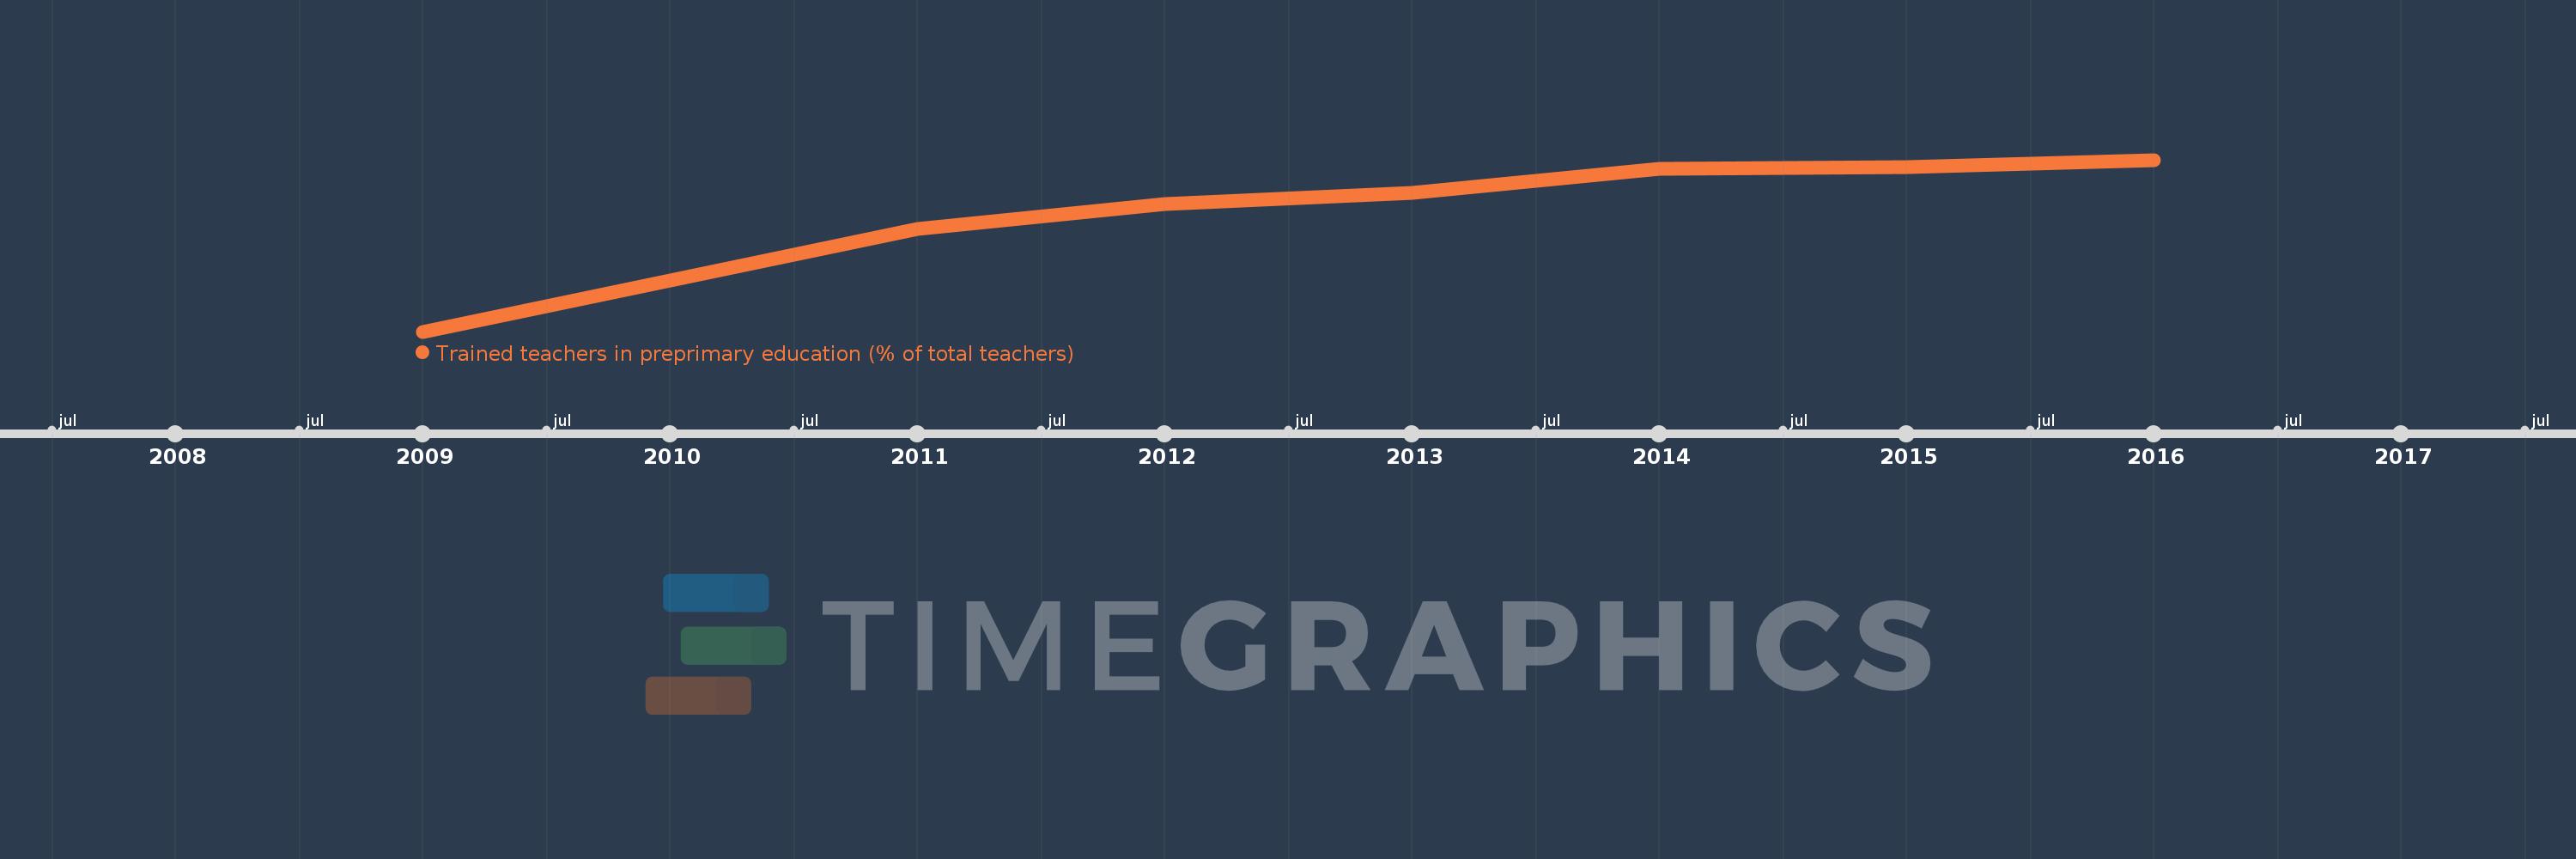
Trained teachers in preprimary education (% of total teachers)
2016,2015,2014,2013,2012,2011,2009
Estas estadísticas en otros países:
línea de tiempo (timeline):
En esta escala de tiempo se presenta un gráfico de 2009 y 2016 de Nepal. Los datos de 2008 están ausentes. El número de observaciones reales por fecha: 7.
Fuente (nombre):
Indicadores del desarrollo mundial
Fuente (organización):
United Nations Educational, Scientific, and Cultural Organization (UNESCO) Institute for Statistics.
Categorías:
Education
Se ha actualizado:
23 abr 2017 año
Los indicadores de los cambios de valor en los últimos años
Mínimo:
72.647
1 ene 2009 año
Máximo:
87.51
1 ene 2016 año
A la fecha de observación
Valor
Cambio absoluto
El cambio con respecto al valor anterior
1 ene 2009 año
72.647
+72.647
0.0%
1 ene 2011 año
81.549
+8.901
12.25%
1 ene 2012 año
83.697
+2.148
2.63%
1 ene 2013 año
84.655
+0.958
1.15%
1 ene 2014 año
86.701
+2.045
2.42%
1 ene 2015 año
86.874
+0.174
0.2%
1 ene 2016 año
87.51
+0.636
0.73%
Ranking de los países por los datos estadísticos actuales


Comentarios: