29
/es/
es
AIzaSyAYiBZKx7MnpbEhh9jyipgxe19OcubqV5w
April 1, 2024
60875
Sub-Saharan Africa (IDA & IBRD countries)
TSS
false
2
1
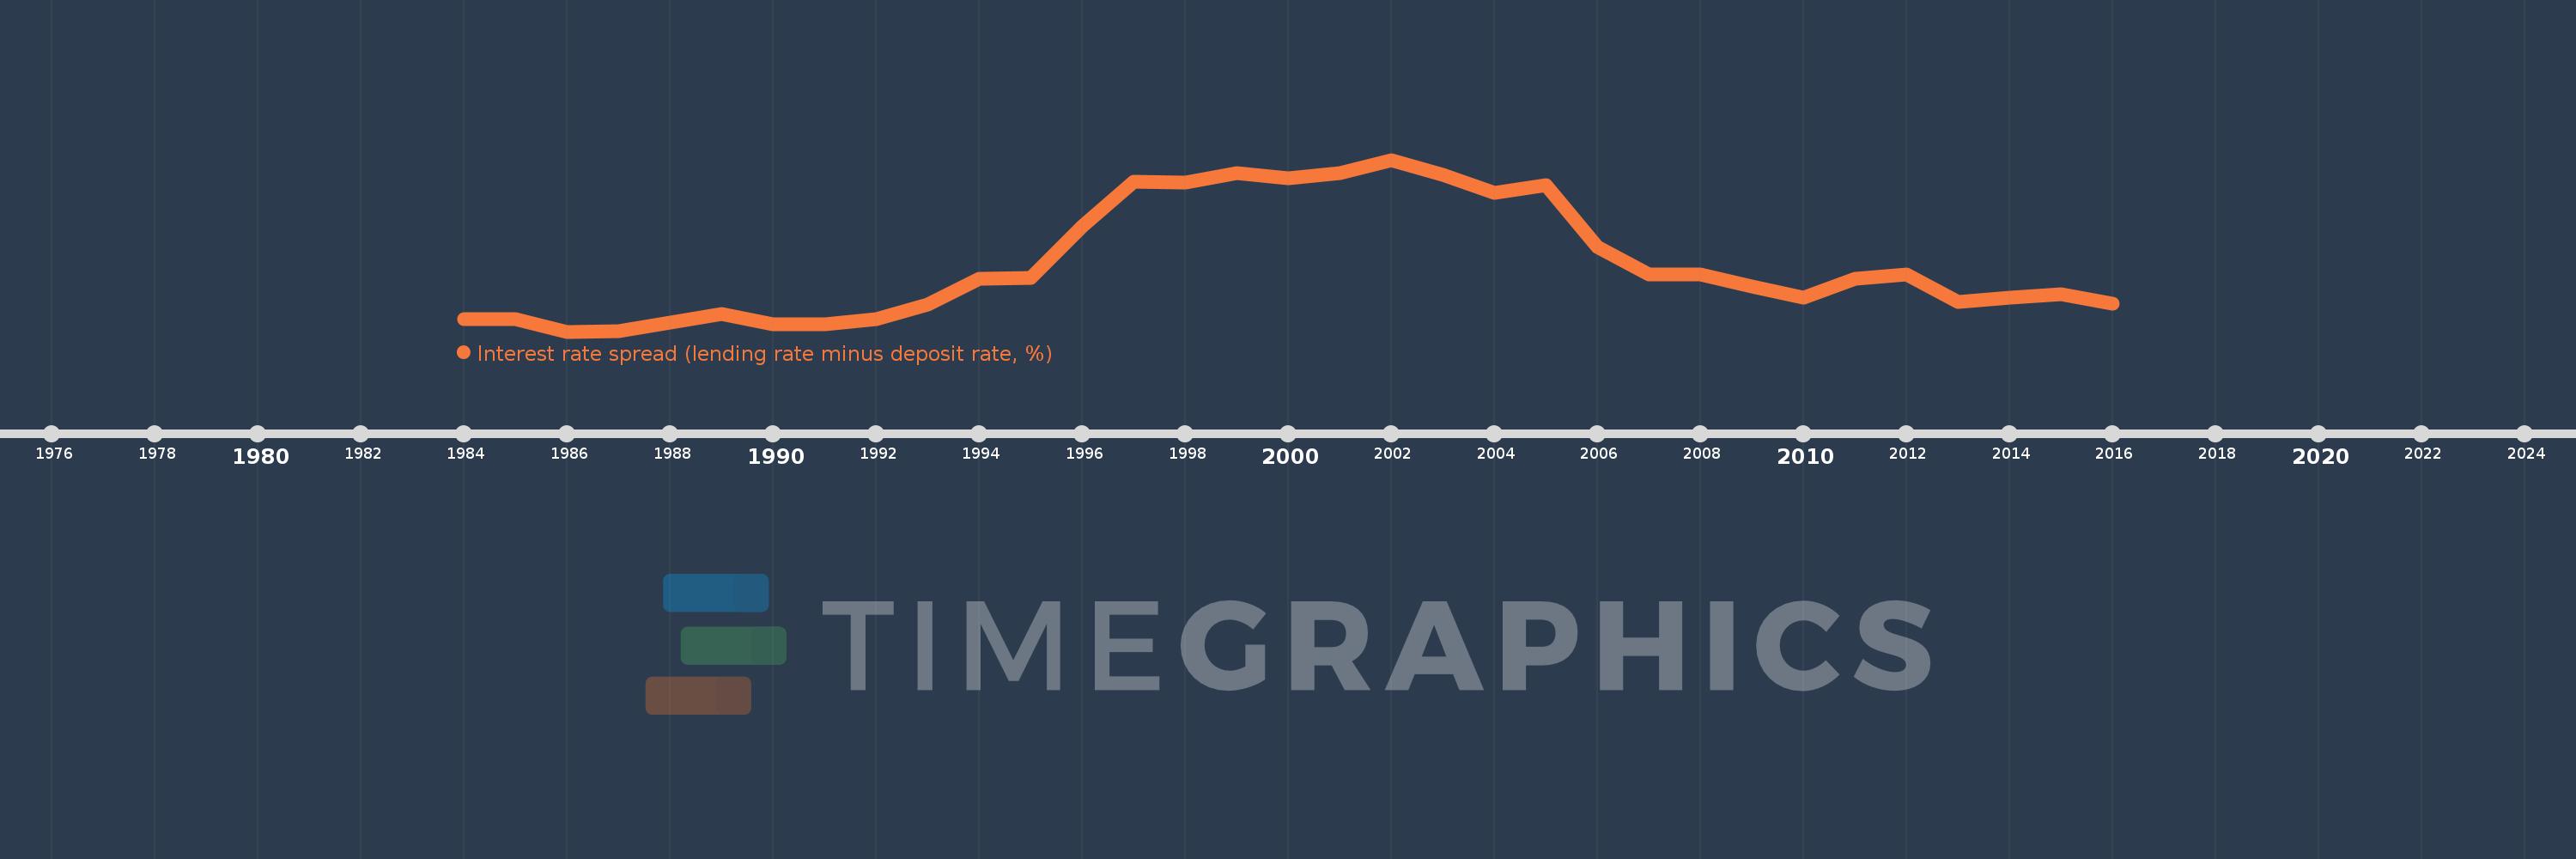
Interest rate spread (lending rate minus deposit rate, %)
2016,2015,2014,2013,2012,2011,2010,2009,2008,2007,2006,2005,2004,2003,2002,2001,2000,1999,1998,1997,1996,1995,1994,1993,1992,1991,1990,1989,1988,1987,1986,1985,1984
Estas estadísticas en otros países:
AlbaniaAlgeriaAngolaAntigua and BarbudaArab WorldArgentinaArmeniaArubaAustraliaAustriaAzerbaijanBahamas, TheBahrainBangladeshBarbadosBelarusBelgiumBelizeBeninBhutanBoliviaBosnia and HerzegovinaBotswanaBrazilBrunei DarussalamBulgariaBurkina FasoBurundiCabo VerdeCameroonCanadaCaribbean small statesCentral African RepublicCentral Europe and the BalticsChadChileChinaColombiaComorosCongo, Dem. Rep.Congo, Rep.Costa RicaCote d'IvoireCroatiaCyprusCzech RepublicDenmarkDjiboutiDominicaDominican RepublicEarly-demographic dividendEast Asia & PacificEast Asia & Pacific (excluding high income)East Asia & Pacific (IDA & IBRD countries)EcuadorEgypt, Arab Rep.Equatorial GuineaEstoniaEthiopiaEuro areaEurope & Central AsiaEurope & Central Asia (excluding high income)Europe & Central Asia (IDA & IBRD countries)European UnionFijiFinlandFragile and conflict affected situationsFranceGabonGambia, TheGeorgiaGermanyGhanaGreeceGrenadaGuatemalaGuineaGuinea-BissauGuyanaHaitiHeavily indebted poor countries (HIPC)High incomeHondurasHong Kong SAR, ChinaHungaryIBRD onlyIcelandIDA & IBRD totalIDA blendIDA onlyIDA totalIndonesiaIran, Islamic Rep.IraqIrelandIsraelItalyJamaicaJapanJordanKenyaKorea, Rep.KosovoKuwaitKyrgyz RepublicLao PDRLate-demographic dividendLatin America & Caribbean Latin America & Caribbean (excluding high income)Latin America & the Caribbean (IDA & IBRD countries)LatviaLeast developed countries: UN classificationLebanonLesothoLiberiaLibyaLithuaniaLow & middle incomeLow incomeLower middle incomeLuxembourgMacao SAR, ChinaMacedonia, FYRMadagascarMalawiMalaysiaMaldivesMaliMaltaMauritaniaMauritiusMexicoMicronesia, Fed. Sts.Middle East & North AfricaMiddle East & North Africa (excluding high income)Middle East & North Africa (IDA & IBRD countries)Middle incomeMoldovaMongoliaMontenegroMoroccoMozambiqueMyanmarNamibiaNepalNetherlandsNew ZealandNicaraguaNigerNigeriaNorwayOECD membersOmanOther small statesPacific island small statesPanamaPapua New GuineaParaguayPeruPhilippinesPolandPortugalPost-demographic dividendPre-demographic dividendQatarRomaniaRussian FederationRwandaSamoaSan MarinoSao Tome and PrincipeSenegalSerbiaSeychellesSierra LeoneSingaporeSlovak RepublicSloveniaSmall statesSolomon IslandsSouth AfricaSouth AsiaSouth Asia (IDA & IBRD)South SudanSpainSri LankaSt. Kitts and NevisSt. LuciaSt. Vincent and the GrenadinesSub-Saharan Africa Sub-Saharan Africa (excluding high income)Sub-Saharan Africa (IDA & IBRD countries)SurinameSwazilandSwedenSwitzerlandSyrian Arab RepublicTajikistanTanzaniaThailandTimor-LesteTogoTongaTrinidad and TobagoTunisiaUgandaUkraineUnited KingdomUpper middle incomeUruguayVanuatuVenezuela, RBVietnamWest Bank and GazaWorldYemen, Rep.ZambiaZimbabwe línea de tiempo (timeline):
En esta escala de tiempo se presenta un gráfico de 1984 y 2016 de Sub-Saharan Africa (IDA & IBRD countries). Los datos de 1983 están ausentes. El número de observaciones reales por fecha: 33.
Fuente (nombre):
Indicadores del desarrollo mundial
Fuente (organización):
International Monetary Fund, International Financial Statistics and data files.
Categorías:
Financial Sector
Se ha actualizado:
23 abr 2017 año
Los indicadores de los cambios de valor en los últimos años
Mínimo:
5.417
1 ene 1986 año
Máximo:
13.718
1 ene 2002 año
A la fecha de observación
Valor
Cambio absoluto
El cambio con respecto al valor anterior
1 ene 1984 año
6.021
+6.021
0.0%
1 ene 1985 año
6.0
-0.021
-0.35%
1 ene 1986 año
5.417
-0.583
-9.72%
1 ene 1987 año
5.458
+0.042
0.77%
1 ene 1988 año
5.854
+0.396
7.25%
1 ene 1989 año
6.25
+0.396
6.76%
1 ene 1990 año
5.767
-0.483
-7.73%
1 ene 1991 año
5.75
-0.017
-0.29%
1 ene 1992 año
6.037
+0.287
4.99%
1 ene 1993 año
6.717
+0.68
11.26%
1 ene 1994 año
7.979
+1.263
18.8%
1 ene 1995 año
7.992
+0.013
0.16%
1 ene 1996 año
10.5
+2.508
31.38%
1 ene 1997 año
12.655
+2.155
20.52%
1 ene 1998 año
12.608
-0.047
-0.37%
1 ene 1999 año
13.092
+0.484
3.84%
1 ene 2000 año
12.822
-0.27
-2.07%
1 ene 2001 año
13.08
+0.259
2.02%
1 ene 2002 año
13.718
+0.638
4.88%
1 ene 2003 año
12.983
-0.735
-5.36%
1 ene 2004 año
12.105
-0.878
-6.77%
1 ene 2005 año
12.512
+0.407
3.36%
1 ene 2006 año
9.5
-3.012
-24.07%
1 ene 2007 año
8.192
-1.308
-13.77%
1 ene 2008 año
8.18
-0.012
-0.15%
1 ene 2009 año
7.583
-0.597
-7.29%
1 ene 2010 año
7.059
-0.525
-6.92%
1 ene 2011 año
7.98
+0.921
13.05%
1 ene 2012 año
8.185
+0.205
2.57%
1 ene 2013 año
6.86
-1.325
-16.19%
1 ene 2014 año
7.07
+0.21
3.07%
1 ene 2015 año
7.209
+0.139
1.97%
1 ene 2016 año
6.772
-0.438
-6.07%
Ranking de los países por los datos estadísticos actuales


Comentarios: