29
/es/
es
AIzaSyAYiBZKx7MnpbEhh9jyipgxe19OcubqV5w
April 1, 2024
38263
IDA blend
IDB
false
2
1
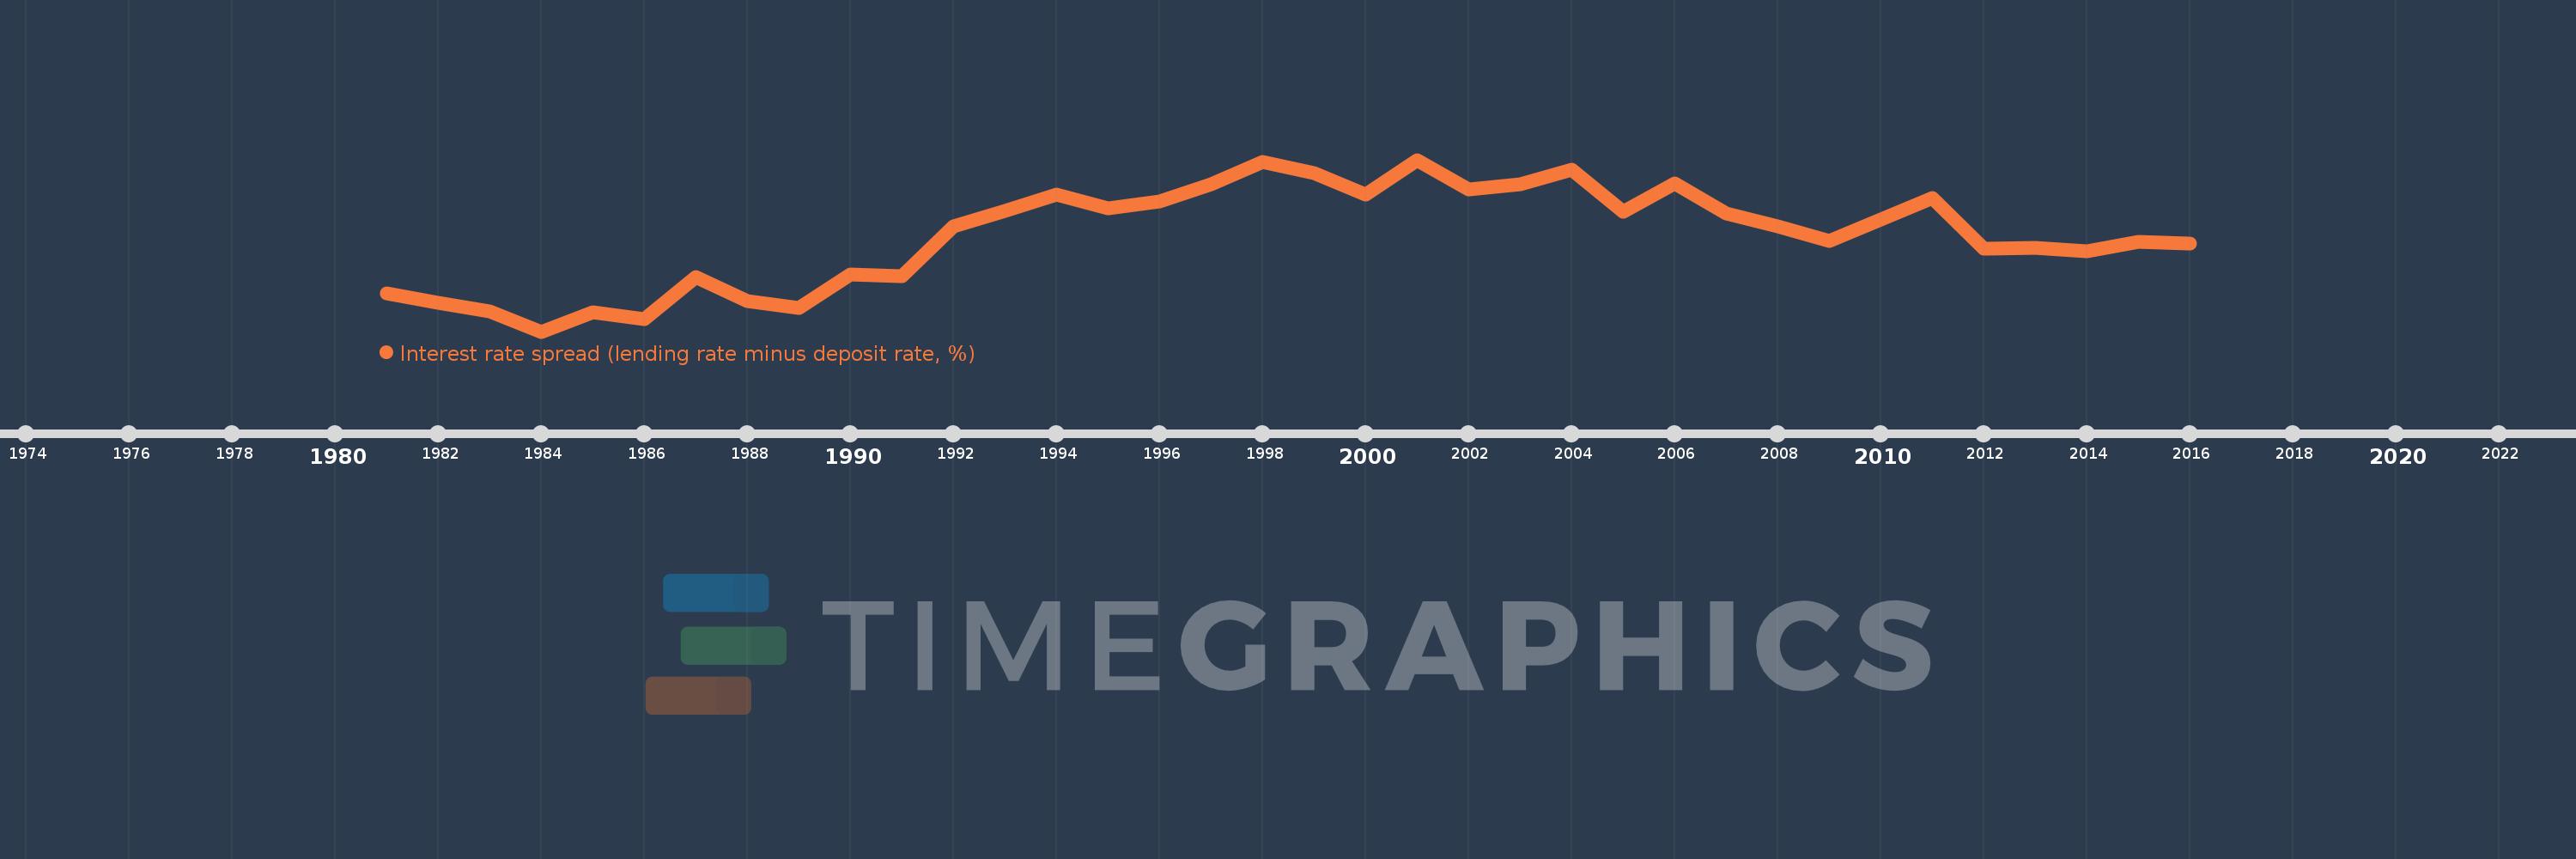
Interest rate spread (lending rate minus deposit rate, %)
2016,2015,2014,2013,2012,2011,2010,2009,2008,2007,2006,2005,2004,2003,2002,2001,2000,1999,1998,1997,1996,1995,1994,1993,1992,1991,1990,1989,1988,1987,1986,1985,1984,1983,1982,1981
Estas estadísticas en otros países:
AlbaniaAlgeriaAngolaAntigua and BarbudaArab WorldArgentinaArmeniaArubaAustraliaAustriaAzerbaijanBahamas, TheBahrainBangladeshBarbadosBelarusBelgiumBelizeBeninBhutanBoliviaBosnia and HerzegovinaBotswanaBrazilBrunei DarussalamBulgariaBurkina FasoBurundiCabo VerdeCameroonCanadaCaribbean small statesCentral African RepublicCentral Europe and the BalticsChadChileChinaColombiaComorosCongo, Dem. Rep.Congo, Rep.Costa RicaCote d'IvoireCroatiaCyprusCzech RepublicDenmarkDjiboutiDominicaDominican RepublicEarly-demographic dividendEast Asia & PacificEast Asia & Pacific (excluding high income)East Asia & Pacific (IDA & IBRD countries)EcuadorEgypt, Arab Rep.Equatorial GuineaEstoniaEthiopiaEuro areaEurope & Central AsiaEurope & Central Asia (excluding high income)Europe & Central Asia (IDA & IBRD countries)European UnionFijiFinlandFragile and conflict affected situationsFranceGabonGambia, TheGeorgiaGermanyGhanaGreeceGrenadaGuatemalaGuineaGuinea-BissauGuyanaHaitiHeavily indebted poor countries (HIPC)High incomeHondurasHong Kong SAR, ChinaHungaryIBRD onlyIcelandIDA & IBRD totalIDA blendIDA onlyIDA totalIndonesiaIran, Islamic Rep.IraqIrelandIsraelItalyJamaicaJapanJordanKenyaKorea, Rep.KosovoKuwaitKyrgyz RepublicLao PDRLate-demographic dividendLatin America & Caribbean Latin America & Caribbean (excluding high income)Latin America & the Caribbean (IDA & IBRD countries)LatviaLeast developed countries: UN classificationLebanonLesothoLiberiaLibyaLithuaniaLow & middle incomeLow incomeLower middle incomeLuxembourgMacao SAR, ChinaMacedonia, FYRMadagascarMalawiMalaysiaMaldivesMaliMaltaMauritaniaMauritiusMexicoMicronesia, Fed. Sts.Middle East & North AfricaMiddle East & North Africa (excluding high income)Middle East & North Africa (IDA & IBRD countries)Middle incomeMoldovaMongoliaMontenegroMoroccoMozambiqueMyanmarNamibiaNepalNetherlandsNew ZealandNicaraguaNigerNigeriaNorwayOECD membersOmanOther small statesPacific island small statesPanamaPapua New GuineaParaguayPeruPhilippinesPolandPortugalPost-demographic dividendPre-demographic dividendQatarRomaniaRussian FederationRwandaSamoaSan MarinoSao Tome and PrincipeSenegalSerbiaSeychellesSierra LeoneSingaporeSlovak RepublicSloveniaSmall statesSolomon IslandsSouth AfricaSouth AsiaSouth Asia (IDA & IBRD)South SudanSpainSri LankaSt. Kitts and NevisSt. LuciaSt. Vincent and the GrenadinesSub-Saharan Africa Sub-Saharan Africa (excluding high income)Sub-Saharan Africa (IDA & IBRD countries)SurinameSwazilandSwedenSwitzerlandSyrian Arab RepublicTajikistanTanzaniaThailandTimor-LesteTogoTongaTrinidad and TobagoTunisiaUgandaUkraineUnited KingdomUpper middle incomeUruguayVanuatuVenezuela, RBVietnamWest Bank and GazaWorldYemen, Rep.ZambiaZimbabwe línea de tiempo (timeline):
En esta escala de tiempo se presenta un gráfico de 1981 y 2016 de IDA blend. Los datos de 1980 están ausentes. El número de observaciones reales por fecha: 36.
Fuente (nombre):
Indicadores del desarrollo mundial
Fuente (organización):
International Monetary Fund, International Financial Statistics and data files.
Categorías:
Financial Sector
Se ha actualizado:
23 abr 2017 año
Los indicadores de los cambios de valor en los últimos años
Mínimo:
4.187
1 ene 1984 año
Máximo:
8.997
1 ene 2001 año
A la fecha de observación
Valor
Cambio absoluto
El cambio con respecto al valor anterior
1 ene 1981 año
5.25
+5.25
0.0%
1 ene 1982 año
5.0
-0.25
-4.76%
1 ene 1983 año
4.75
-0.25
-5.0%
1 ene 1984 año
4.187
-0.563
-11.84%
1 ene 1985 año
4.729
+0.542
12.94%
1 ene 1986 año
4.542
-0.187
-3.96%
1 ene 1987 año
5.708
+1.167
25.69%
1 ene 1988 año
5.042
-0.667
-11.68%
1 ene 1989 año
4.854
-0.187
-3.72%
1 ene 1990 año
5.792
+0.937
19.31%
1 ene 1991 año
5.75
-0.042
-0.72%
1 ene 1992 año
7.128
+1.378
23.97%
1 ene 1993 año
7.561
+0.433
6.07%
1 ene 1994 año
8.026
+0.465
6.15%
1 ene 1995 año
7.632
-0.395
-4.92%
1 ene 1996 año
7.831
+0.199
2.61%
1 ene 1997 año
8.319
+0.488
6.23%
1 ene 1998 año
8.944
+0.625
7.51%
1 ene 1999 año
8.613
-0.331
-3.7%
1 ene 2000 año
8.013
-0.6
-6.96%
1 ene 2001 año
8.997
+0.984
12.28%
1 ene 2002 año
8.179
-0.818
-9.09%
1 ene 2003 año
8.322
+0.143
1.75%
1 ene 2004 año
8.73
+0.408
4.9%
1 ene 2005 año
7.537
-1.193
-13.67%
1 ene 2006 año
8.339
+0.802
10.65%
1 ene 2007 año
7.495
-0.844
-10.12%
1 ene 2008 año
7.143
-0.352
-4.7%
1 ene 2009 año
6.733
-0.41
-5.74%
1 ene 2010 año
7.331
+0.598
8.88%
1 ene 2011 año
7.926
+0.595
8.12%
1 ene 2012 año
6.508
-1.418
-17.89%
1 ene 2013 año
6.539
+0.031
0.47%
1 ene 2014 año
6.436
-0.102
-1.56%
1 ene 2015 año
6.71
+0.274
4.26%
1 ene 2016 año
6.659
-0.051
-0.76%
Ranking de los países por los datos estadísticos actuales


Comentarios: