30
/es/
AIzaSyAYiBZKx7MnpbEhh9jyipgxe19OcubqV5w
April 1, 2024
50129
Middle East & North Africa (IDA & IBRD countries)
TMN
false
2
1
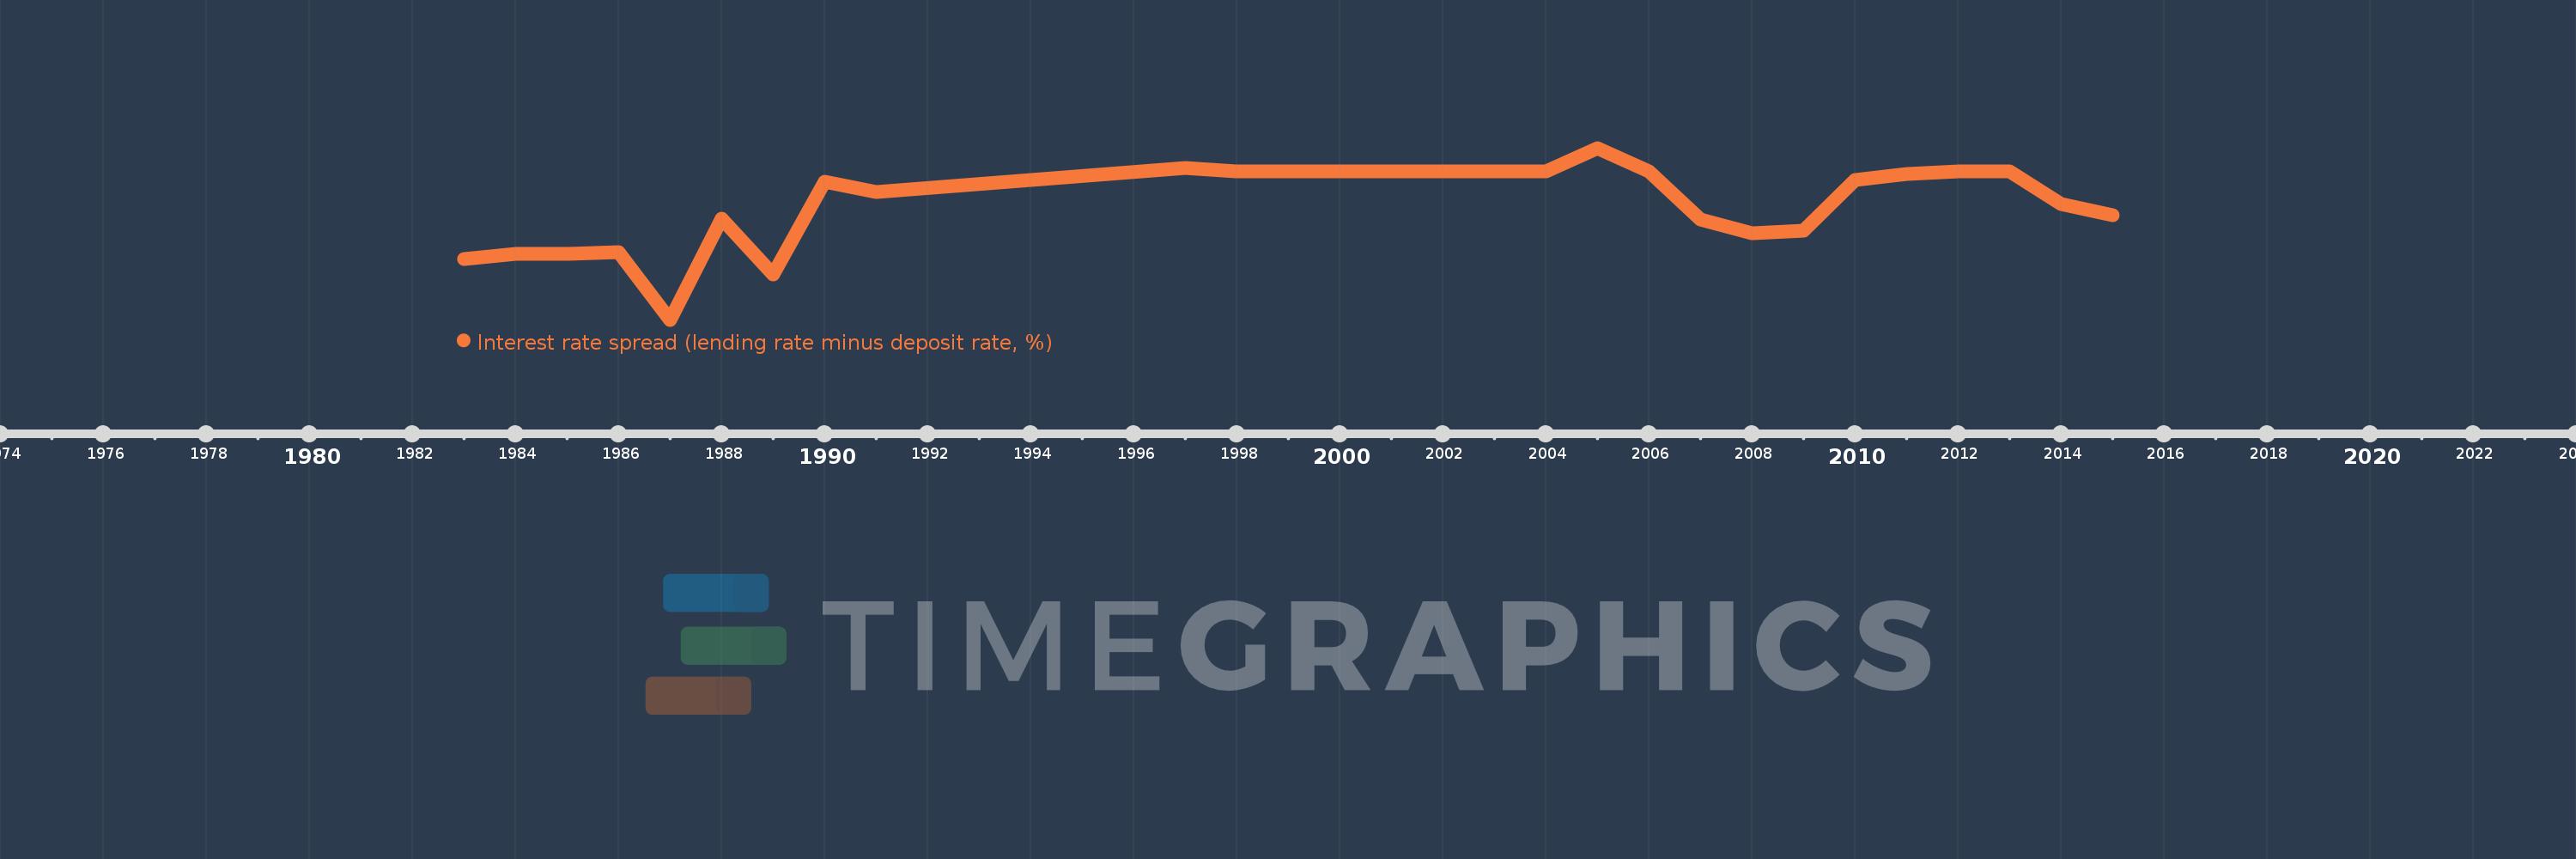
Interest rate spread (lending rate minus deposit rate, %)
2015,2014,2013,2012,2011,2010,2009,2008,2007,2006,2005,2004,2003,2002,2001,2000,1999,1998,1997,1991,1990,1989,1988,1987,1986,1985,1984,1983
