29
/es/
es
AIzaSyAYiBZKx7MnpbEhh9jyipgxe19OcubqV5w
April 1, 2024
60377
Sub-Saharan Africa (excluding high income)
SSA
false
2
1
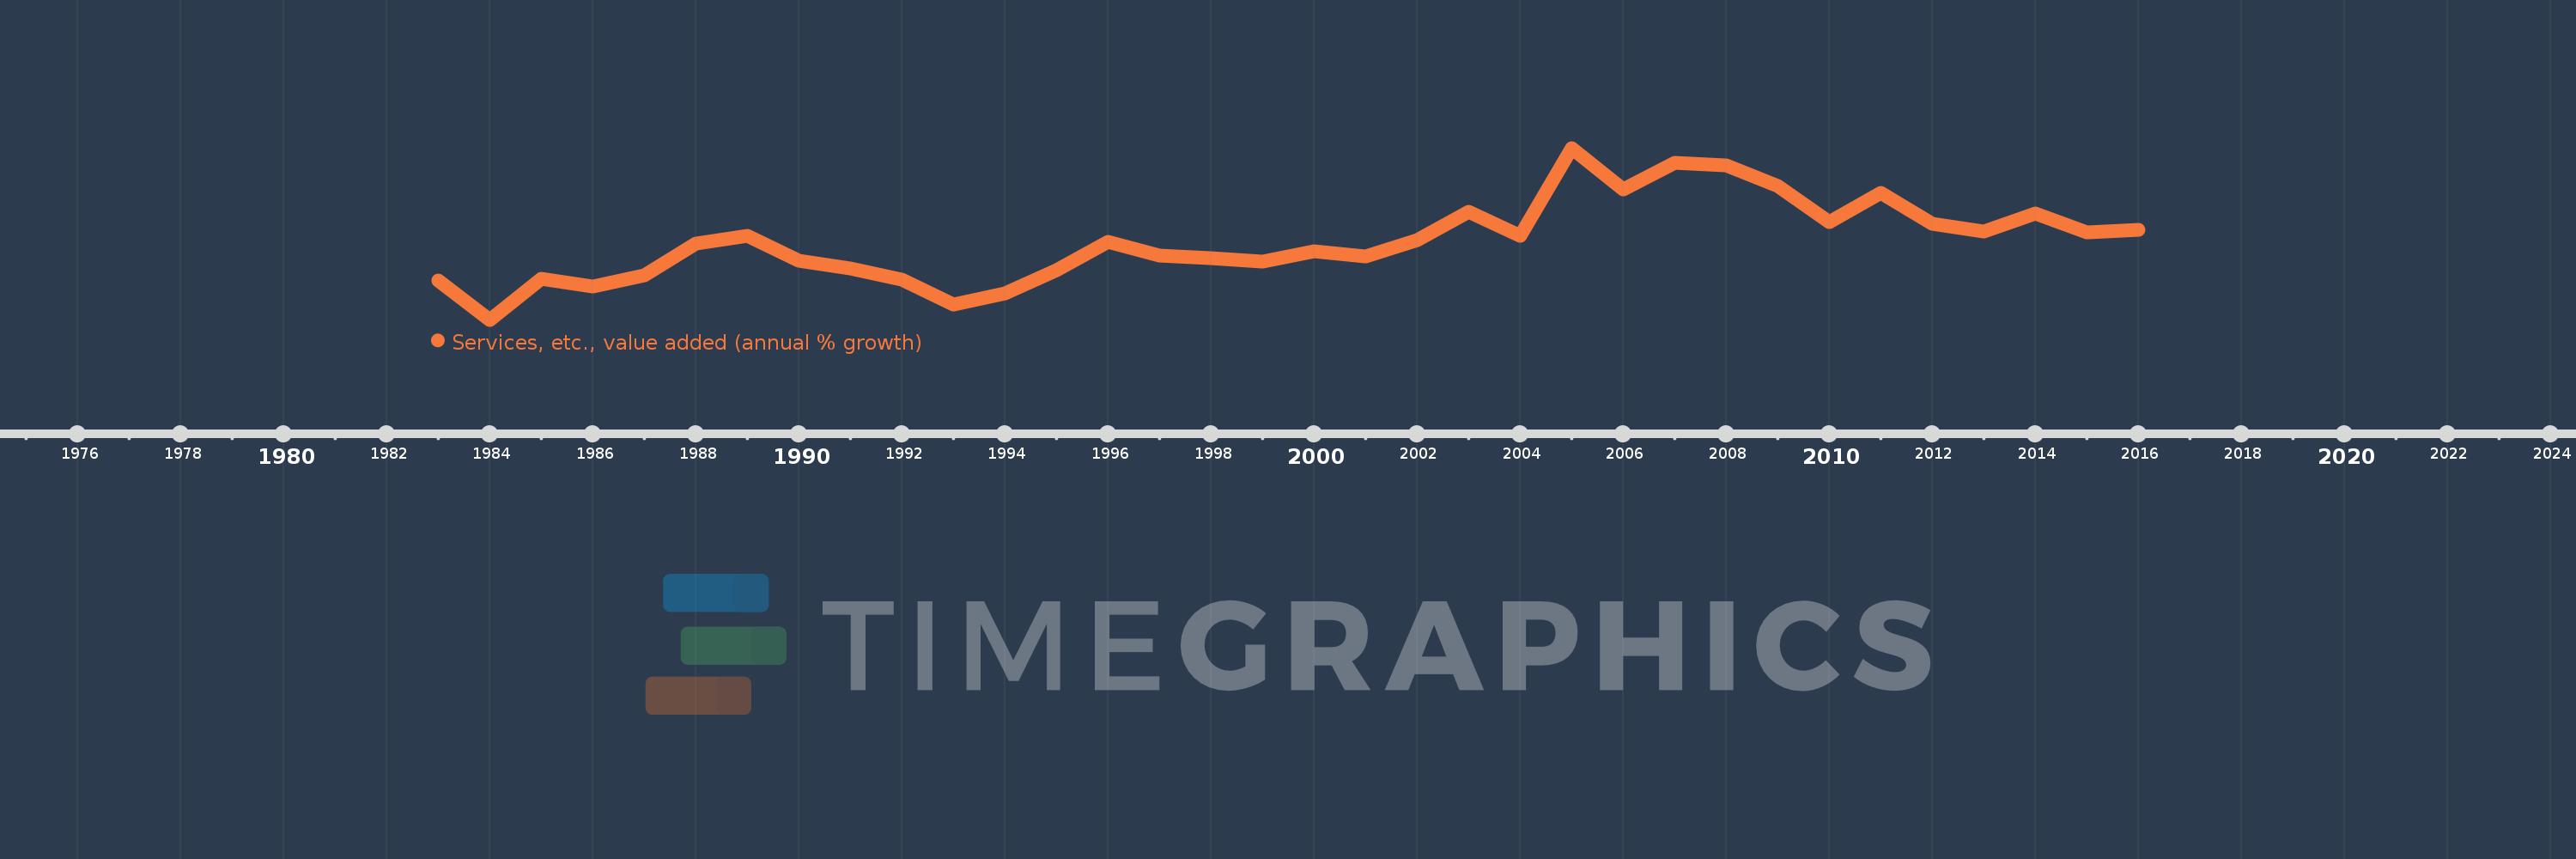
Services, etc., value added (annual % growth)
2016,2015,2014,2013,2012,2011,2010,2009,2008,2007,2006,2005,2004,2003,2002,2001,2000,1999,1998,1997,1996,1995,1994,1993,1992,1991,1990,1989,1988,1987,1986,1985,1984,1983
Estas estadísticas en otros países:
AfghanistanAlbaniaAlgeriaAntigua and BarbudaArab WorldArgentinaArmeniaAustraliaAustriaAzerbaijanBahamas, TheBahrainBangladeshBelarusBelgiumBelizeBeninBermudaBhutanBoliviaBosnia and HerzegovinaBotswanaBrazilBrunei DarussalamBulgariaBurkina FasoBurundiCabo VerdeCambodiaCameroonCanadaCaribbean small statesCentral African RepublicCentral Europe and the BalticsChadChileChinaColombiaComorosCongo, Dem. Rep.Congo, Rep.Costa RicaCote d'IvoireCroatiaCubaCyprusCzech RepublicDenmarkDjiboutiDominicaDominican RepublicEarly-demographic dividendEast Asia & PacificEast Asia & Pacific (excluding high income)East Asia & Pacific (IDA & IBRD countries)EcuadorEgypt, Arab Rep.El SalvadorEquatorial GuineaEritreaEstoniaEthiopiaEuro areaEurope & Central AsiaEurope & Central Asia (excluding high income)Europe & Central Asia (IDA & IBRD countries)European UnionFijiFinlandFragile and conflict affected situationsFranceGabonGambia, TheGeorgiaGermanyGhanaGreeceGrenadaGuatemalaGuineaGuinea-BissauGuyanaHaitiHeavily indebted poor countries (HIPC)High incomeHondurasHong Kong SAR, ChinaHungaryIBRD onlyIcelandIDA & IBRD totalIDA blendIDA onlyIDA totalIndiaIndonesiaIran, Islamic Rep.IraqIrelandItalyJamaicaJapanJordanKazakhstanKenyaKiribatiKorea, Rep.KosovoKuwaitKyrgyz RepublicLao PDRLate-demographic dividendLatin America & Caribbean Latin America & Caribbean (excluding high income)Latin America & the Caribbean (IDA & IBRD countries)LatviaLeast developed countries: UN classificationLebanonLesothoLiberiaLithuaniaLow & middle incomeLow incomeLower middle incomeLuxembourgMacedonia, FYRMadagascarMalawiMalaysiaMaldivesMaliMarshall IslandsMauritaniaMauritiusMexicoMicronesia, Fed. Sts.Middle East & North AfricaMiddle East & North Africa (excluding high income)Middle East & North Africa (IDA & IBRD countries)Middle incomeMoldovaMongoliaMontenegroMoroccoMozambiqueMyanmarNamibiaNepalNetherlandsNew ZealandNicaraguaNigerNigeriaNorth AmericaNorwayOECD membersOmanOther small statesPacific island small statesPakistanPalauPanamaPapua New GuineaParaguayPeruPhilippinesPolandPortugalPost-demographic dividendPre-demographic dividendPuerto RicoQatarRomaniaRussian FederationRwandaSamoaSao Tome and PrincipeSaudi ArabiaSenegalSerbiaSeychellesSierra LeoneSingaporeSlovak RepublicSloveniaSmall statesSolomon IslandsSomaliaSouth AfricaSouth AsiaSouth Asia (IDA & IBRD)SpainSri LankaSt. Kitts and NevisSt. LuciaSt. Vincent and the GrenadinesSub-Saharan Africa Sub-Saharan Africa (excluding high income)Sub-Saharan Africa (IDA & IBRD countries)SudanSurinameSwazilandSwedenSwitzerlandSyrian Arab RepublicTajikistanTanzaniaThailandTimor-LesteTogoTongaTrinidad and TobagoTunisiaTurkeyTurkmenistanTuvaluUgandaUkraineUnited Arab EmiratesUnited KingdomUnited StatesUpper middle incomeUruguayUzbekistanVanuatuVenezuela, RBVietnamWest Bank and GazaWorldZambiaZimbabwe línea de tiempo (timeline):
En esta escala de tiempo se presenta un gráfico de 1983 y 2016 de Sub-Saharan Africa (excluding high income). Los datos de 1982 están ausentes. El número de observaciones reales por fecha: 34.
Fuente (nombre):
Indicadores del desarrollo mundial
Fuente (organización):
World Bank national accounts data, and OECD National Accounts data files.
Categorías:
Economy & Growth
Se ha actualizado:
23 abr 2017 año
Los indicadores de los cambios de valor en los últimos años
Mínimo:
-0.845
1 ene 1984 año
Máximo:
9.689
1 ene 2005 año
A la fecha de observación
Valor
Cambio absoluto
El cambio con respecto al valor anterior
1 ene 1983 año
1.538
+1.538
0.0%
1 ene 1984 año
-0.845
-2.383
-154.95%
1 ene 1985 año
1.658
+2.503
-296.1%
1 ene 1986 año
1.174
-0.484
-29.19%
1 ene 1987 año
1.892
+0.719
61.25%
1 ene 1988 año
3.812
+1.919
101.41%
1 ene 1989 año
4.314
+0.503
13.2%
1 ene 1990 año
2.797
-1.518
-35.18%
1 ene 1991 año
2.305
-0.492
-17.59%
1 ene 1992 año
1.599
-0.706
-30.61%
1 ene 1993 año
0.068
-1.532
-95.76%
1 ene 1994 año
0.781
+0.713
1.05 mil%
1 ene 1995 año
2.182
+1.401
179.36%
1 ene 1996 año
3.906
+1.724
78.97%
1 ene 1997 año
3.079
-0.827
-21.17%
1 ene 1998 año
2.906
-0.172
-5.6%
1 ene 1999 año
2.739
-0.168
-5.77%
1 ene 2000 año
3.348
+0.609
22.26%
1 ene 2001 año
3.055
-0.293
-8.76%
1 ene 2002 año
4.044
+0.989
32.37%
1 ene 2003 año
5.758
+1.714
42.39%
1 ene 2004 año
4.294
-1.463
-25.42%
1 ene 2005 año
9.689
+5.395
125.63%
1 ene 2006 año
7.152
-2.538
-26.19%
1 ene 2007 año
8.77
+1.618
22.62%
1 ene 2008 año
8.644
-0.126
-1.44%
1 ene 2009 año
7.37
-1.274
-14.73%
1 ene 2010 año
5.163
-2.207
-29.94%
1 ene 2011 año
6.952
+1.789
34.64%
1 ene 2012 año
5.056
-1.896
-27.27%
1 ene 2013 año
4.564
-0.492
-9.73%
1 ene 2014 año
5.652
+1.088
23.85%
1 ene 2015 año
4.523
-1.13
-19.98%
1 ene 2016 año
4.67
+0.148
3.26%
Ranking de los países por los datos estadísticos actuales


Comentarios: