29
/es/
es
AIzaSyAYiBZKx7MnpbEhh9jyipgxe19OcubqV5w
April 1, 2024
262985
Thailand
THA
true
2
1
Services, etc., value added (annual % growth)
2016,2015,2014,2013,2012,2011,2010,2009,2008,2007,2006,2005,2004,2003,2002,2001,2000,1999,1998,1997,1996,1995,1994,1993,1992,1991,1990,1989,1988,1987,1986,1985,1984,1983,1982,1981,1980,1979,1978,1977,1976,1975,1974,1973,1972,1971,1970,1969,1968,1967,1966,1965,1964,1963,1962
Estas estadísticas en otros países:
AfghanistanAlbaniaAlgeriaAntigua and BarbudaArab WorldArgentinaArmeniaAustraliaAustriaAzerbaijanBahamas, TheBahrainBangladeshBelarusBelgiumBelizeBeninBermudaBhutanBoliviaBosnia and HerzegovinaBotswanaBrazilBrunei DarussalamBulgariaBurkina FasoBurundiCabo VerdeCambodiaCameroonCanadaCaribbean small statesCentral African RepublicCentral Europe and the BalticsChadChileChinaColombiaComorosCongo, Dem. Rep.Congo, Rep.Costa RicaCote d'IvoireCroatiaCubaCyprusCzech RepublicDenmarkDjiboutiDominicaDominican RepublicEarly-demographic dividendEast Asia & PacificEast Asia & Pacific (excluding high income)East Asia & Pacific (IDA & IBRD countries)EcuadorEgypt, Arab Rep.El SalvadorEquatorial GuineaEritreaEstoniaEthiopiaEuro areaEurope & Central AsiaEurope & Central Asia (excluding high income)Europe & Central Asia (IDA & IBRD countries)European UnionFijiFinlandFragile and conflict affected situationsFranceGabonGambia, TheGeorgiaGermanyGhanaGreeceGrenadaGuatemalaGuineaGuinea-BissauGuyanaHaitiHeavily indebted poor countries (HIPC)High incomeHondurasHong Kong SAR, ChinaHungaryIBRD onlyIcelandIDA & IBRD totalIDA blendIDA onlyIDA totalIndiaIndonesiaIran, Islamic Rep.IraqIrelandItalyJamaicaJapanJordanKazakhstanKenyaKiribatiKorea, Rep.KosovoKuwaitKyrgyz RepublicLao PDRLate-demographic dividendLatin America & Caribbean Latin America & Caribbean (excluding high income)Latin America & the Caribbean (IDA & IBRD countries)LatviaLeast developed countries: UN classificationLebanonLesothoLiberiaLithuaniaLow & middle incomeLow incomeLower middle incomeLuxembourgMacedonia, FYRMadagascarMalawiMalaysiaMaldivesMaliMarshall IslandsMauritaniaMauritiusMexicoMicronesia, Fed. Sts.Middle East & North AfricaMiddle East & North Africa (excluding high income)Middle East & North Africa (IDA & IBRD countries)Middle incomeMoldovaMongoliaMontenegroMoroccoMozambiqueMyanmarNamibiaNepalNetherlandsNew ZealandNicaraguaNigerNigeriaNorth AmericaNorwayOECD membersOmanOther small statesPacific island small statesPakistanPalauPanamaPapua New GuineaParaguayPeruPhilippinesPolandPortugalPost-demographic dividendPre-demographic dividendPuerto RicoQatarRomaniaRussian FederationRwandaSamoaSao Tome and PrincipeSaudi ArabiaSenegalSerbiaSeychellesSierra LeoneSingaporeSlovak RepublicSloveniaSmall statesSolomon IslandsSomaliaSouth AfricaSouth AsiaSouth Asia (IDA & IBRD)SpainSri LankaSt. Kitts and NevisSt. LuciaSt. Vincent and the GrenadinesSub-Saharan Africa Sub-Saharan Africa (excluding high income)Sub-Saharan Africa (IDA & IBRD countries)SudanSurinameSwazilandSwedenSwitzerlandSyrian Arab RepublicTajikistanTanzaniaThailandTimor-LesteTogoTongaTrinidad and TobagoTunisiaTurkeyTurkmenistanTuvaluUgandaUkraineUnited Arab EmiratesUnited KingdomUnited StatesUpper middle incomeUruguayUzbekistanVanuatuVenezuela, RBVietnamWest Bank and GazaWorldZambiaZimbabwe línea de tiempo (timeline):
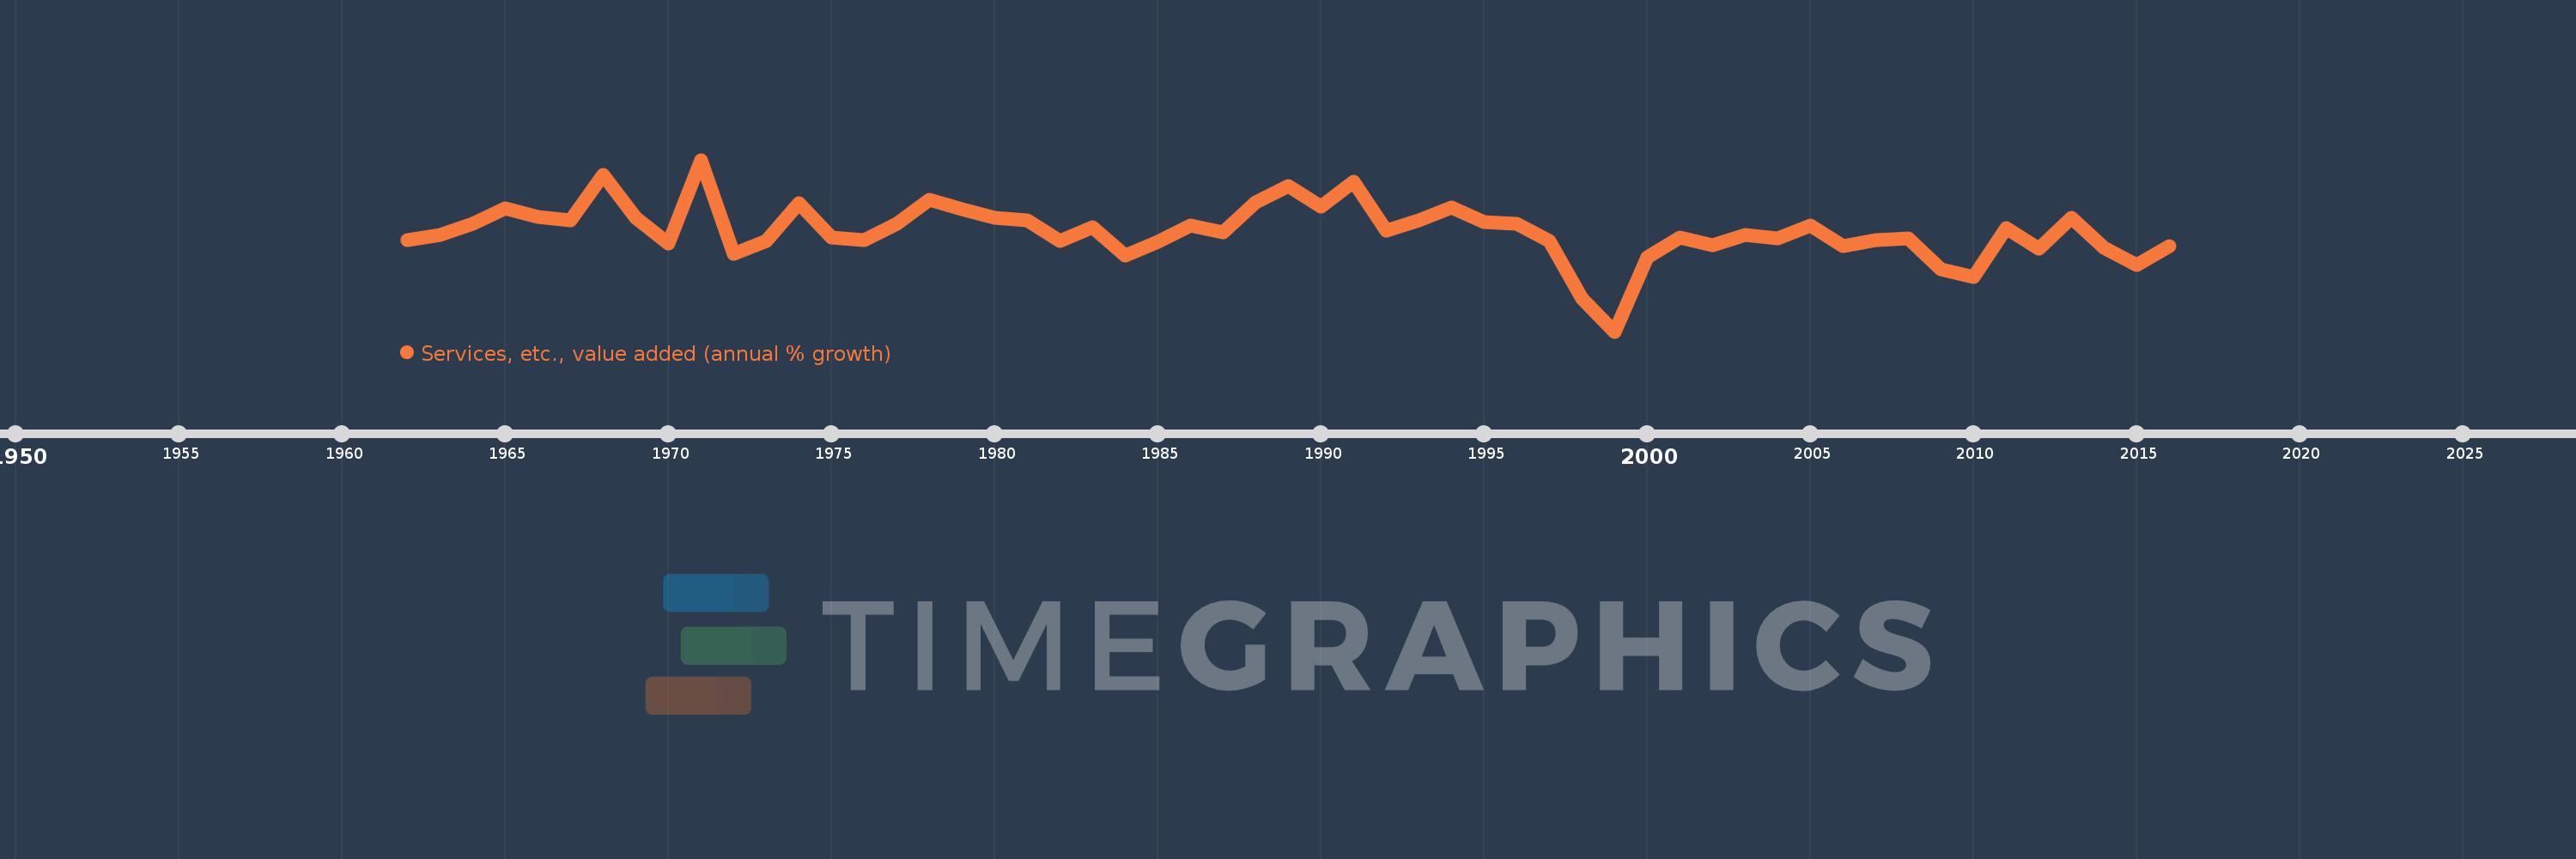
En esta escala de tiempo se presenta un gráfico de 1962 y 2016 de Thailand. Los datos de 1961 están ausentes. El número de observaciones reales por fecha: 55.
Fuente (nombre):
Indicadores del desarrollo mundial
Fuente (organización):
World Bank national accounts data, and OECD National Accounts data files.
Categorías:
Economy & Growth
Se ha actualizado:
23 abr 2017 año
Los indicadores de los cambios de valor en los últimos años
Mínimo:
-7.16
1 ene 1999 año
Máximo:
15.561
1 ene 1971 año
A la fecha de observación
Valor
Cambio absoluto
El cambio con respecto al valor anterior
1 ene 1962 año
4.905
+4.905
0.0%
1 ene 1963 año
5.594
+0.689
14.05%
1 ene 1964 año
7.113
+1.519
27.15%
1 ene 1965 año
9.192
+2.079
29.24%
1 ene 1966 año
7.956
-1.236
-13.45%
1 ene 1967 año
7.608
-0.347
-4.37%
1 ene 1968 año
13.627
+6.019
79.11%
1 ene 1969 año
7.865
-5.762
-42.28%
1 ene 1970 año
4.516
-3.349
-42.58%
1 ene 1971 año
15.561
+11.046
244.6%
1 ene 1972 año
3.164
-12.397
-79.67%
1 ene 1973 año
4.834
+1.67
52.77%
1 ene 1974 año
9.769
+4.934
102.07%
1 ene 1975 año
5.293
-4.475
-45.81%
1 ene 1976 año
4.993
-0.3
-5.67%
1 ene 1977 año
7.122
+2.129
42.64%
1 ene 1978 año
10.249
+3.127
43.9%
1 ene 1979 año
9.069
-1.18
-11.52%
1 ene 1980 año
7.935
-1.134
-12.5%
1 ene 1981 año
7.596
-0.339
-4.27%
1 ene 1982 año
4.834
-2.763
-36.37%
1 ene 1983 año
6.648
+1.814
37.53%
1 ene 1984 año
2.907
-3.741
-56.27%
1 ene 1985 año
4.694
+1.788
61.5%
1 ene 1986 año
6.875
+2.18
46.45%
1 ene 1987 año
5.937
-0.938
-13.64%
1 ene 1988 año
9.976
+4.039
68.04%
1 ene 1989 año
12.117
+2.141
21.46%
1 ene 1990 año
9.326
-2.791
-23.03%
1 ene 1991 año
12.697
+3.371
36.15%
1 ene 1992 año
6.142
-6.556
-51.63%
1 ene 1993 año
7.509
+1.368
22.27%
1 ene 1994 año
9.275
+1.766
23.51%
1 ene 1995 año
7.271
-2.004
-21.6%
1 ene 1996 año
7.151
-0.12
-1.65%
1 ene 1997 año
4.783
-2.368
-33.11%
1 ene 1998 año
-2.782
-7.565
-158.16%
1 ene 1999 año
-7.16
-4.378
157.38%
1 ene 2000 año
2.641
+9.801
-136.88%
1 ene 2001 año
5.254
+2.613
98.93%
1 ene 2002 año
4.276
-0.978
-18.61%
1 ene 2003 año
5.604
+1.328
31.07%
1 ene 2004 año
5.159
-0.446
-7.95%
1 ene 2005 año
6.907
+1.749
33.9%
1 ene 2006 año
4.113
-2.794
-40.45%
1 ene 2007 año
4.935
+0.822
19.98%
1 ene 2008 año
5.123
+0.188
3.81%
1 ene 2009 año
1.123
-4.0
-78.08%
1 ene 2010 año
0.087
-1.036
-92.22%
1 ene 2011 año
6.539
+6.451
7.38 mil%
1 ene 2012 año
3.783
-2.756
-42.14%
1 ene 2013 año
7.838
+4.054
107.17%
1 ene 2014 año
3.87
-3.968
-50.62%
1 ene 2015 año
1.604
-2.266
-58.56%
1 ene 2016 año
4.089
+2.485
154.95%
Ranking de los países por los datos estadísticos actuales


Comentarios: