29
/es/
es
AIzaSyAYiBZKx7MnpbEhh9jyipgxe19OcubqV5w
April 1, 2024
134593
France
FRA
true
2
1
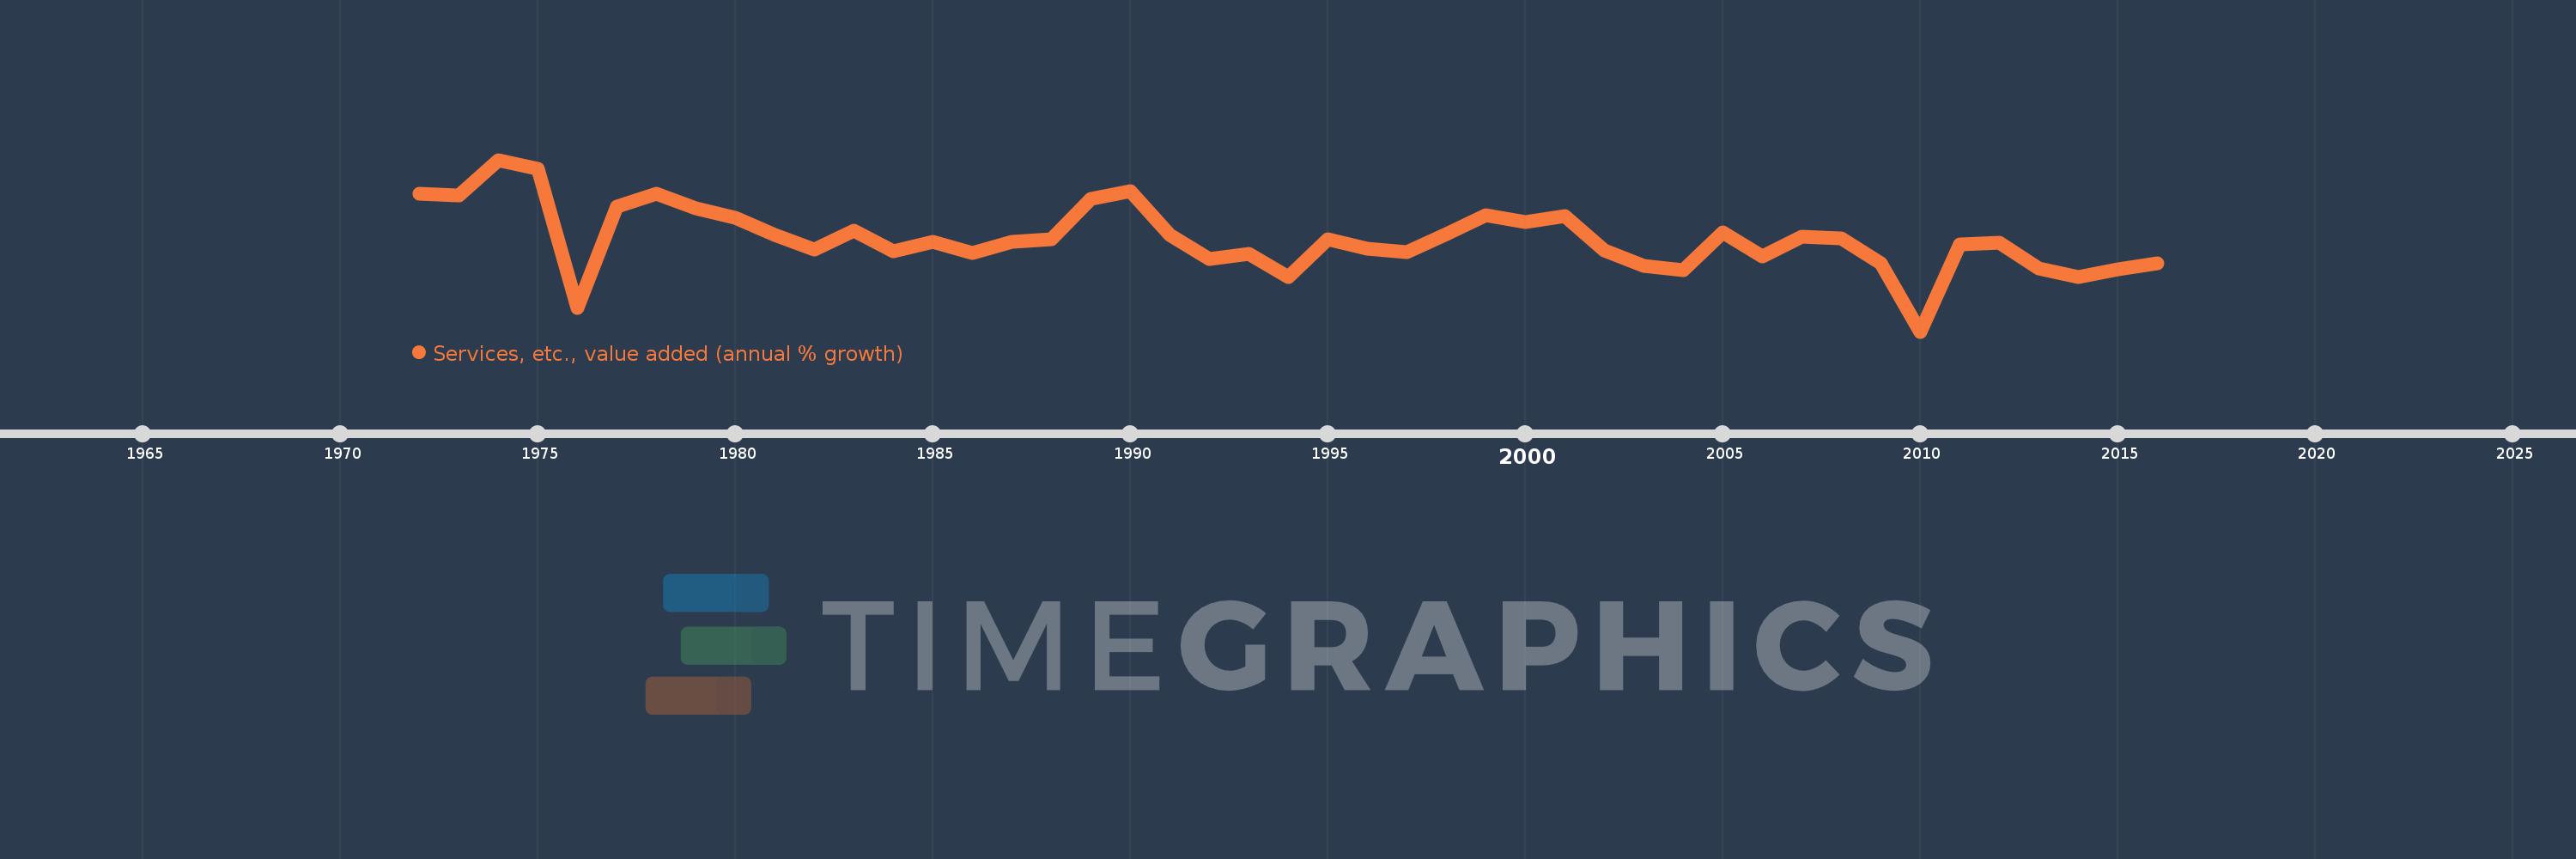
Services, etc., value added (annual % growth)
2016,2015,2014,2013,2012,2011,2010,2009,2008,2007,2006,2005,2004,2003,2002,2001,2000,1999,1998,1997,1996,1995,1994,1993,1992,1991,1990,1989,1988,1987,1986,1985,1984,1983,1982,1981,1980,1979,1978,1977,1976,1975,1974,1973,1972
Estas estadísticas en otros países:
AfghanistanAlbaniaAlgeriaAntigua and BarbudaArab WorldArgentinaArmeniaAustraliaAustriaAzerbaijanBahamas, TheBahrainBangladeshBelarusBelgiumBelizeBeninBermudaBhutanBoliviaBosnia and HerzegovinaBotswanaBrazilBrunei DarussalamBulgariaBurkina FasoBurundiCabo VerdeCambodiaCameroonCanadaCaribbean small statesCentral African RepublicCentral Europe and the BalticsChadChileChinaColombiaComorosCongo, Dem. Rep.Congo, Rep.Costa RicaCote d'IvoireCroatiaCubaCyprusCzech RepublicDenmarkDjiboutiDominicaDominican RepublicEarly-demographic dividendEast Asia & PacificEast Asia & Pacific (excluding high income)East Asia & Pacific (IDA & IBRD countries)EcuadorEgypt, Arab Rep.El SalvadorEquatorial GuineaEritreaEstoniaEthiopiaEuro areaEurope & Central AsiaEurope & Central Asia (excluding high income)Europe & Central Asia (IDA & IBRD countries)European UnionFijiFinlandFragile and conflict affected situationsFranceGabonGambia, TheGeorgiaGermanyGhanaGreeceGrenadaGuatemalaGuineaGuinea-BissauGuyanaHaitiHeavily indebted poor countries (HIPC)High incomeHondurasHong Kong SAR, ChinaHungaryIBRD onlyIcelandIDA & IBRD totalIDA blendIDA onlyIDA totalIndiaIndonesiaIran, Islamic Rep.IraqIrelandItalyJamaicaJapanJordanKazakhstanKenyaKiribatiKorea, Rep.KosovoKuwaitKyrgyz RepublicLao PDRLate-demographic dividendLatin America & Caribbean Latin America & Caribbean (excluding high income)Latin America & the Caribbean (IDA & IBRD countries)LatviaLeast developed countries: UN classificationLebanonLesothoLiberiaLithuaniaLow & middle incomeLow incomeLower middle incomeLuxembourgMacedonia, FYRMadagascarMalawiMalaysiaMaldivesMaliMarshall IslandsMauritaniaMauritiusMexicoMicronesia, Fed. Sts.Middle East & North AfricaMiddle East & North Africa (excluding high income)Middle East & North Africa (IDA & IBRD countries)Middle incomeMoldovaMongoliaMontenegroMoroccoMozambiqueMyanmarNamibiaNepalNetherlandsNew ZealandNicaraguaNigerNigeriaNorth AmericaNorwayOECD membersOmanOther small statesPacific island small statesPakistanPalauPanamaPapua New GuineaParaguayPeruPhilippinesPolandPortugalPost-demographic dividendPre-demographic dividendPuerto RicoQatarRomaniaRussian FederationRwandaSamoaSao Tome and PrincipeSaudi ArabiaSenegalSerbiaSeychellesSierra LeoneSingaporeSlovak RepublicSloveniaSmall statesSolomon IslandsSomaliaSouth AfricaSouth AsiaSouth Asia (IDA & IBRD)SpainSri LankaSt. Kitts and NevisSt. LuciaSt. Vincent and the GrenadinesSub-Saharan Africa Sub-Saharan Africa (excluding high income)Sub-Saharan Africa (IDA & IBRD countries)SudanSurinameSwazilandSwedenSwitzerlandSyrian Arab RepublicTajikistanTanzaniaThailandTimor-LesteTogoTongaTrinidad and TobagoTunisiaTurkeyTurkmenistanTuvaluUgandaUkraineUnited Arab EmiratesUnited KingdomUnited StatesUpper middle incomeUruguayUzbekistanVanuatuVenezuela, RBVietnamWest Bank and GazaWorldZambiaZimbabwe línea de tiempo (timeline):
En esta escala de tiempo se presenta un gráfico de 1972 y 2016 de France. Los datos de 1971 están ausentes. El número de observaciones reales por fecha: 45.
Fuente (nombre):
Indicadores del desarrollo mundial
Fuente (organización):
World Bank national accounts data, and OECD National Accounts data files.
Categorías:
Economy & Growth
Se ha actualizado:
23 abr 2017 año
Los indicadores de los cambios de valor en los últimos años
Mínimo:
-2.021
1 ene 2010 año
Máximo:
6.302
1 ene 1974 año
A la fecha de observación
Valor
Cambio absoluto
El cambio con respecto al valor anterior
1 ene 1972 año
4.677
+4.677
0.0%
1 ene 1973 año
4.584
-0.094
-2.0%
1 ene 1974 año
6.302
+1.718
37.49%
1 ene 1975 año
5.883
-0.419
-6.64%
1 ene 1976 año
-0.882
-6.766
-115.0%
1 ene 1977 año
4.045
+4.927
-558.45%
1 ene 1978 año
4.644
+0.599
14.8%
1 ene 1979 año
3.946
-0.698
-15.02%
1 ene 1980 año
3.487
-0.459
-11.64%
1 ene 1981 año
2.659
-0.827
-23.72%
1 ene 1982 año
1.961
-0.698
-26.25%
1 ene 1983 año
2.861
+0.9
45.87%
1 ene 1984 año
1.884
-0.977
-34.15%
1 ene 1985 año
2.314
+0.43
22.82%
1 ene 1986 año
1.768
-0.546
-23.59%
1 ene 1987 año
2.337
+0.568
32.15%
1 ene 1988 año
2.463
+0.126
5.4%
1 ene 1989 año
4.39
+1.927
78.25%
1 ene 1990 año
4.796
+0.406
9.25%
1 ene 1991 año
2.654
-2.142
-44.66%
1 ene 1992 año
1.503
-1.15
-43.35%
1 ene 1993 año
1.764
+0.261
17.33%
1 ene 1994 año
0.612
-1.152
-65.29%
1 ene 1995 año
2.46
+1.847
301.73%
1 ene 1996 año
1.989
-0.471
-19.13%
1 ene 1997 año
1.843
-0.146
-7.36%
1 ene 1998 año
2.707
+0.864
46.89%
1 ene 1999 año
3.601
+0.895
33.06%
1 ene 2000 año
3.294
-0.307
-8.54%
1 ene 2001 año
3.586
+0.292
8.87%
1 ene 2002 año
1.928
-1.658
-46.23%
1 ene 2003 año
1.172
-0.757
-39.25%
1 ene 2004 año
0.954
-0.217
-18.55%
1 ene 2005 año
2.8
+1.846
193.49%
1 ene 2006 año
1.628
-1.172
-41.87%
1 ene 2007 año
2.574
+0.946
58.11%
1 ene 2008 año
2.489
-0.085
-3.31%
1 ene 2009 año
1.306
-1.183
-47.52%
1 ene 2010 año
-2.021
-3.327
-254.74%
1 ene 2011 año
2.184
+4.205
-208.05%
1 ene 2012 año
2.279
+0.095
4.35%
1 ene 2013 año
1.023
-1.256
-55.1%
1 ene 2014 año
0.62
-0.403
-39.39%
1 ene 2015 año
0.994
+0.374
60.33%
1 ene 2016 año
1.299
+0.305
30.69%
Ranking de los países por los datos estadísticos actuales


Comentarios: