29
/es/
es
AIzaSyAYiBZKx7MnpbEhh9jyipgxe19OcubqV5w
April 1, 2024
58973
Sub-Saharan Africa
SSF
false
2
1
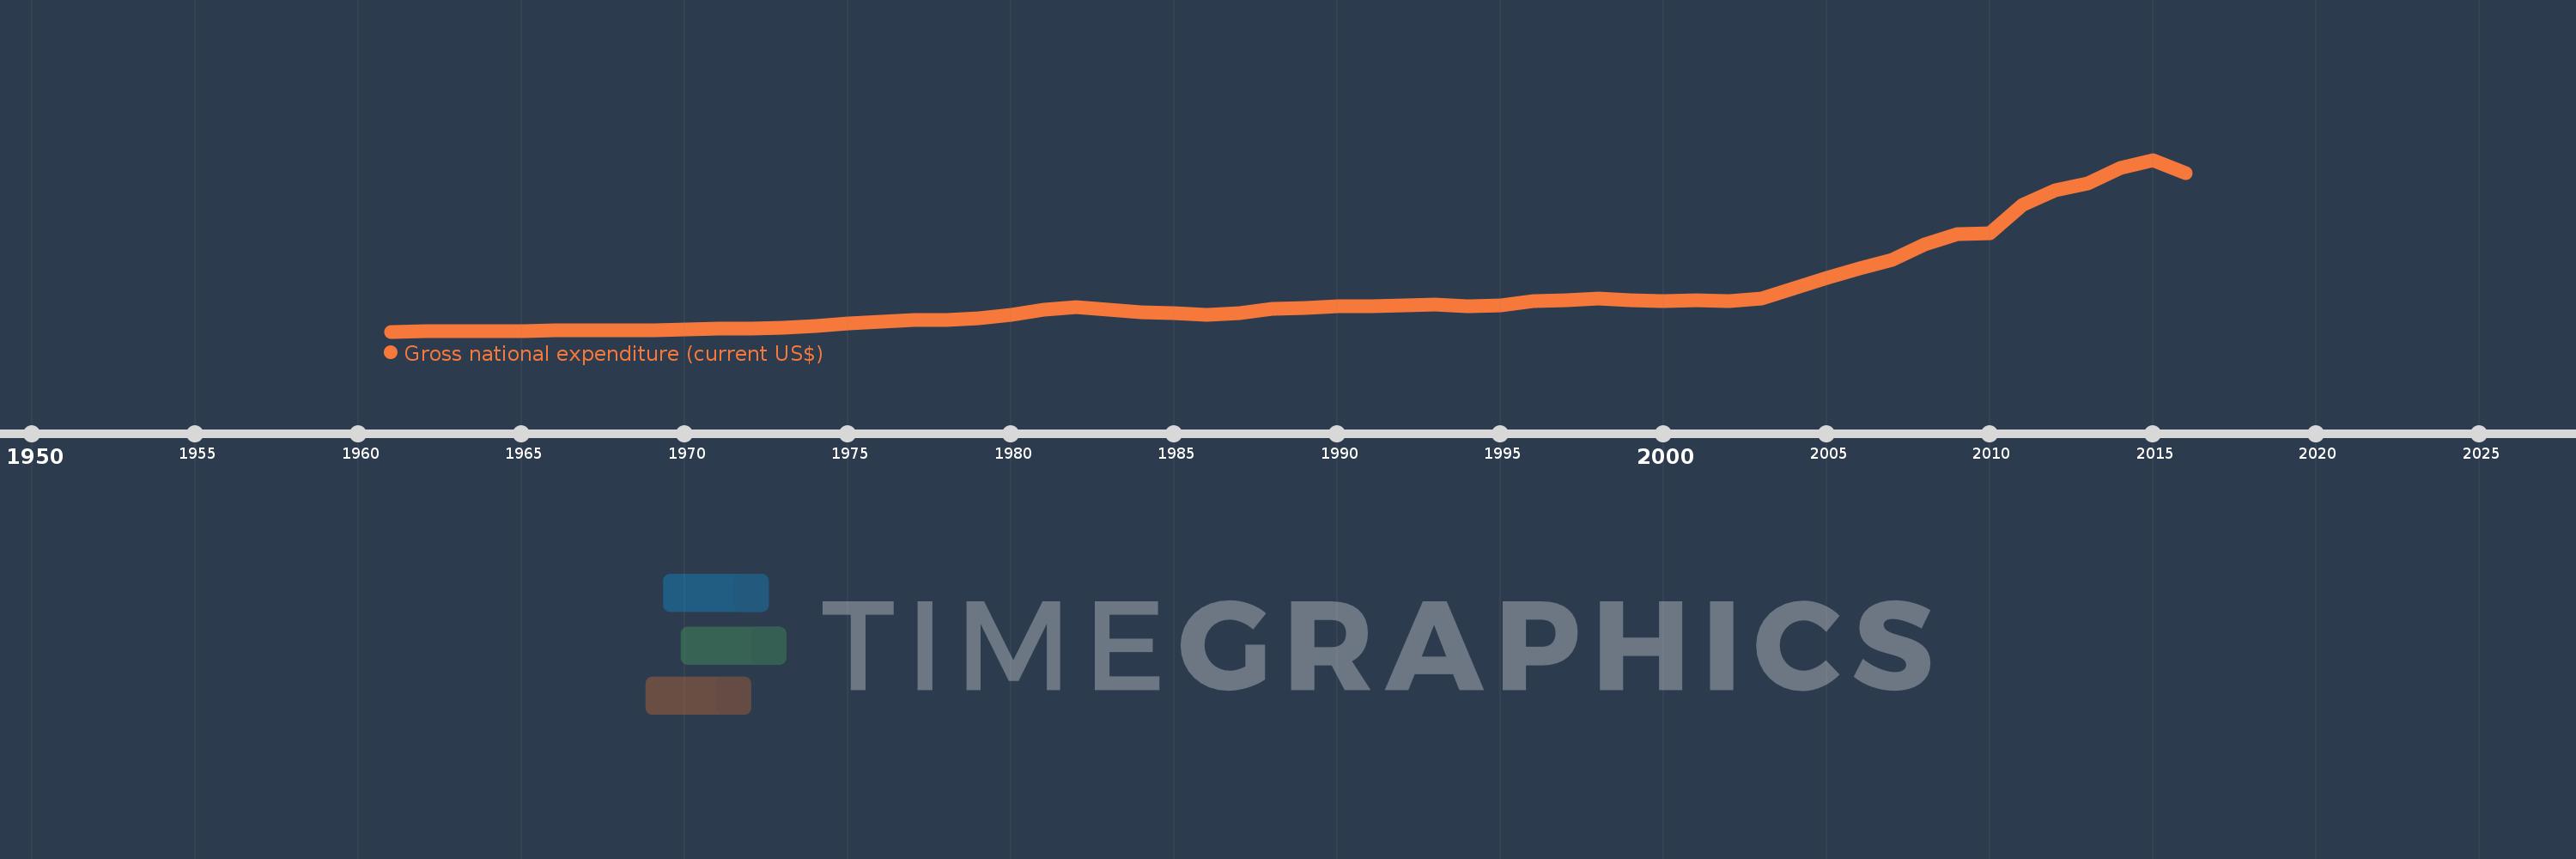
Gross national expenditure (current US$)
2016,2015,2014,2013,2012,2011,2010,2009,2008,2007,2006,2005,2004,2003,2002,2001,2000,1999,1998,1997,1996,1995,1994,1993,1992,1991,1990,1989,1988,1987,1986,1985,1984,1983,1982,1981,1980,1979,1978,1977,1976,1975,1974,1973,1972,1971,1970,1969,1968,1967,1966,1965,1964,1963,1962,1961
Estas estadísticas en otros países:
AfghanistanAlbaniaAlgeriaAngolaAntigua and BarbudaArab WorldArgentinaArmeniaArubaAustraliaAustriaAzerbaijanBahamas, TheBahrainBangladeshBarbadosBelarusBelgiumBelizeBeninBermudaBhutanBoliviaBosnia and HerzegovinaBotswanaBrazilBrunei DarussalamBulgariaBurkina FasoBurundiCabo VerdeCambodiaCameroonCanadaCaribbean small statesCentral African RepublicCentral Europe and the BalticsChadChileChinaColombiaComorosCongo, Dem. Rep.Congo, Rep.Costa RicaCote d'IvoireCroatiaCubaCyprusCzech RepublicDenmarkDjiboutiDominicaDominican RepublicEarly-demographic dividendEast Asia & PacificEast Asia & Pacific (excluding high income)East Asia & Pacific (IDA & IBRD countries)EcuadorEgypt, Arab Rep.El SalvadorEquatorial GuineaEritreaEstoniaEthiopiaEuro areaEurope & Central AsiaEurope & Central Asia (excluding high income)Europe & Central Asia (IDA & IBRD countries)European UnionFaroe IslandsFijiFinlandFragile and conflict affected situationsFranceFrench PolynesiaGabonGambia, TheGeorgiaGermanyGhanaGreeceGrenadaGuatemalaGuineaGuinea-BissauGuyanaHaitiHeavily indebted poor countries (HIPC)High incomeHondurasHong Kong SAR, ChinaHungaryIBRD onlyIcelandIDA & IBRD totalIDA blendIDA onlyIDA totalIndiaIndonesiaIran, Islamic Rep.IraqIrelandIsraelItalyJamaicaJapanJordanKazakhstanKenyaKiribatiKorea, Rep.KosovoKuwaitKyrgyz RepublicLao PDRLate-demographic dividendLatin America & Caribbean Latin America & Caribbean (excluding high income)Latin America & the Caribbean (IDA & IBRD countries)LatviaLeast developed countries: UN classificationLebanonLesothoLiberiaLibyaLithuaniaLow & middle incomeLow incomeLower middle incomeLuxembourgMacao SAR, ChinaMacedonia, FYRMadagascarMalawiMalaysiaMaldivesMaliMaltaMauritaniaMauritiusMexicoMicronesia, Fed. Sts.Middle East & North AfricaMiddle East & North Africa (excluding high income)Middle East & North Africa (IDA & IBRD countries)Middle incomeMoldovaMongoliaMontenegroMoroccoMozambiqueMyanmarNamibiaNepalNetherlandsNew CaledoniaNew ZealandNicaraguaNigerNigeriaNorth AmericaNorwayOECD membersOmanOther small statesPacific island small statesPakistanPalauPanamaPapua New GuineaParaguayPeruPhilippinesPolandPortugalPost-demographic dividendPre-demographic dividendPuerto RicoQatarRomaniaRussian FederationRwandaSamoaSaudi ArabiaSenegalSerbiaSeychellesSierra LeoneSingaporeSlovak RepublicSloveniaSmall statesSolomon IslandsSomaliaSouth AfricaSouth AsiaSouth Asia (IDA & IBRD)South SudanSpainSri LankaSt. Kitts and NevisSt. LuciaSt. Vincent and the GrenadinesSub-Saharan Africa Sub-Saharan Africa (excluding high income)Sub-Saharan Africa (IDA & IBRD countries)SudanSurinameSwazilandSwedenSwitzerlandSyrian Arab RepublicTajikistanTanzaniaThailandTimor-LesteTogoTongaTrinidad and TobagoTunisiaTurkeyTurkmenistanUgandaUkraineUnited Arab EmiratesUnited KingdomUnited StatesUpper middle incomeUruguayUzbekistanVanuatuVenezuela, RBVietnamWest Bank and GazaWorldYemen, Rep.ZambiaZimbabwe línea de tiempo (timeline):
En esta escala de tiempo se presenta un gráfico de 1961 y 2016 de Sub-Saharan Africa . Los datos de 1960 están ausentes. El número de observaciones reales por fecha: 56.
Fuente (nombre):
Indicadores del desarrollo mundial
Fuente (organización):
World Bank national accounts data, and OECD National Accounts data files.
Categorías:
Economy & Growth
Se ha actualizado:
23 abr 2017 año
Los indicadores de los cambios de valor en los últimos años
Mínimo:
25.979 bn
1 ene 1961 año
Máximo:
1.805 billones
1 ene 2015 año
A la fecha de observación
Valor
Cambio absoluto
El cambio con respecto al valor anterior
1 ene 1961 año
25.979 bn
+25.979 bn
0.0%
1 ene 1962 año
27.333 bn
+1.353 bn
5.21%
1 ene 1963 año
29.043 bn
+1.71 bn
6.26%
1 ene 1964 año
31.654 bn
+2.612 bn
8.99%
1 ene 1965 año
34.769 bn
+3.114 bn
9.84%
1 ene 1966 año
38.207 bn
+3.438 bn
9.89%
1 ene 1967 año
40.401 bn
+2.195 bn
5.74%
1 ene 1968 año
41.28 bn
+879.349 millones
2.18%
1 ene 1969 año
42.941 bn
+1.661 bn
4.02%
1 ene 1970 año
48.641 bn
+5.7 bn
13.27%
1 ene 1971 año
60.342 bn
+11.701 bn
24.06%
1 ene 1972 año
61.2 bn
+857.332 millones
1.42%
1 ene 1973 año
66.49 bn
+5.29 bn
8.64%
1 ene 1974 año
84.974 bn
+18.484 bn
27.8%
1 ene 1975 año
111.141 bn
+26.167 bn
30.79%
1 ene 1976 año
131.322 bn
+20.182 bn
18.16%
1 ene 1977 año
143.617 bn
+12.294 bn
9.36%
1 ene 1978 año
150.425 bn
+6.809 bn
4.74%
1 ene 1979 año
167.79 bn
+17.364 bn
11.54%
1 ene 1980 año
199.087 bn
+31.297 bn
18.65%
1 ene 1981 año
251.059 bn
+51.972 bn
26.11%
1 ene 1982 año
277.065 bn
+26.006 bn
10.36%
1 ene 1983 año
251.489 bn
-25.576 bn
-9.23%
1 ene 1984 año
226.665 bn
-24.824 bn
-9.87%
1 ene 1985 año
216.882 bn
-9.782 bn
-4.32%
1 ene 1986 año
196.171 bn
-20.711 bn
-9.55%
1 ene 1987 año
221.383 bn
+25.212 bn
12.85%
1 ene 1988 año
260.048 bn
+38.666 bn
17.47%
1 ene 1989 año
274.652 bn
+14.603 bn
5.62%
1 ene 1990 año
284.323 bn
+9.672 bn
3.52%
1 ene 1991 año
287.232 bn
+2.909 bn
1.02%
1 ene 1992 año
296.422 bn
+9.19 bn
3.2%
1 ene 1993 año
303.382 bn
+6.96 bn
2.35%
1 ene 1994 año
291.647 bn
-11.735 bn
-3.87%
1 ene 1995 año
294.504 bn
+2.857 bn
0.98%
1 ene 1996 año
341.386 bn
+46.883 bn
15.92%
1 ene 1997 año
349.516 bn
+8.129 bn
2.38%
1 ene 1998 año
365.213 bn
+15.697 bn
4.49%
1 ene 1999 año
354.7 bn
-10.514 bn
-2.88%
1 ene 2000 año
345.891 bn
-8.809 bn
-2.48%
1 ene 2001 año
353.253 bn
+7.362 bn
2.13%
1 ene 2002 año
341.519 bn
-11.734 bn
-3.32%
1 ene 2003 año
364.305 bn
+22.786 bn
6.67%
1 ene 2004 año
475.188 bn
+110.883 bn
30.44%
1 ene 2005 año
585.274 bn
+110.087 bn
23.17%
1 ene 2006 año
676.36 bn
+91.085 bn
15.56%
1 ene 2007 año
769.558 bn
+93.199 bn
13.78%
1 ene 2008 año
929.745 bn
+160.187 bn
20.82%
1 ene 2009 año
1.033 billones
+103.04 bn
11.08%
1 ene 2010 año
1.044 billones
+11.24 bn
1.09%
1 ene 2011 año
1.342 billones
+298.036 bn
28.55%
1 ene 2012 año
1.489 billones
+147.147 bn
10.96%
1 ene 2013 año
1.561 billones
+71.482 bn
4.8%
1 ene 2014 año
1.724 billones
+162.883 bn
10.44%
1 ene 2015 año
1.805 billones
+81.672 bn
4.74%
1 ene 2016 año
1.671 billones
-134.624 bn
-7.46%
Ranking de los países por los datos estadísticos actuales


Comentarios: