29
/es/
es
AIzaSyAYiBZKx7MnpbEhh9jyipgxe19OcubqV5w
April 1, 2024
37407
IDA & IBRD total
IBT
false
2
1
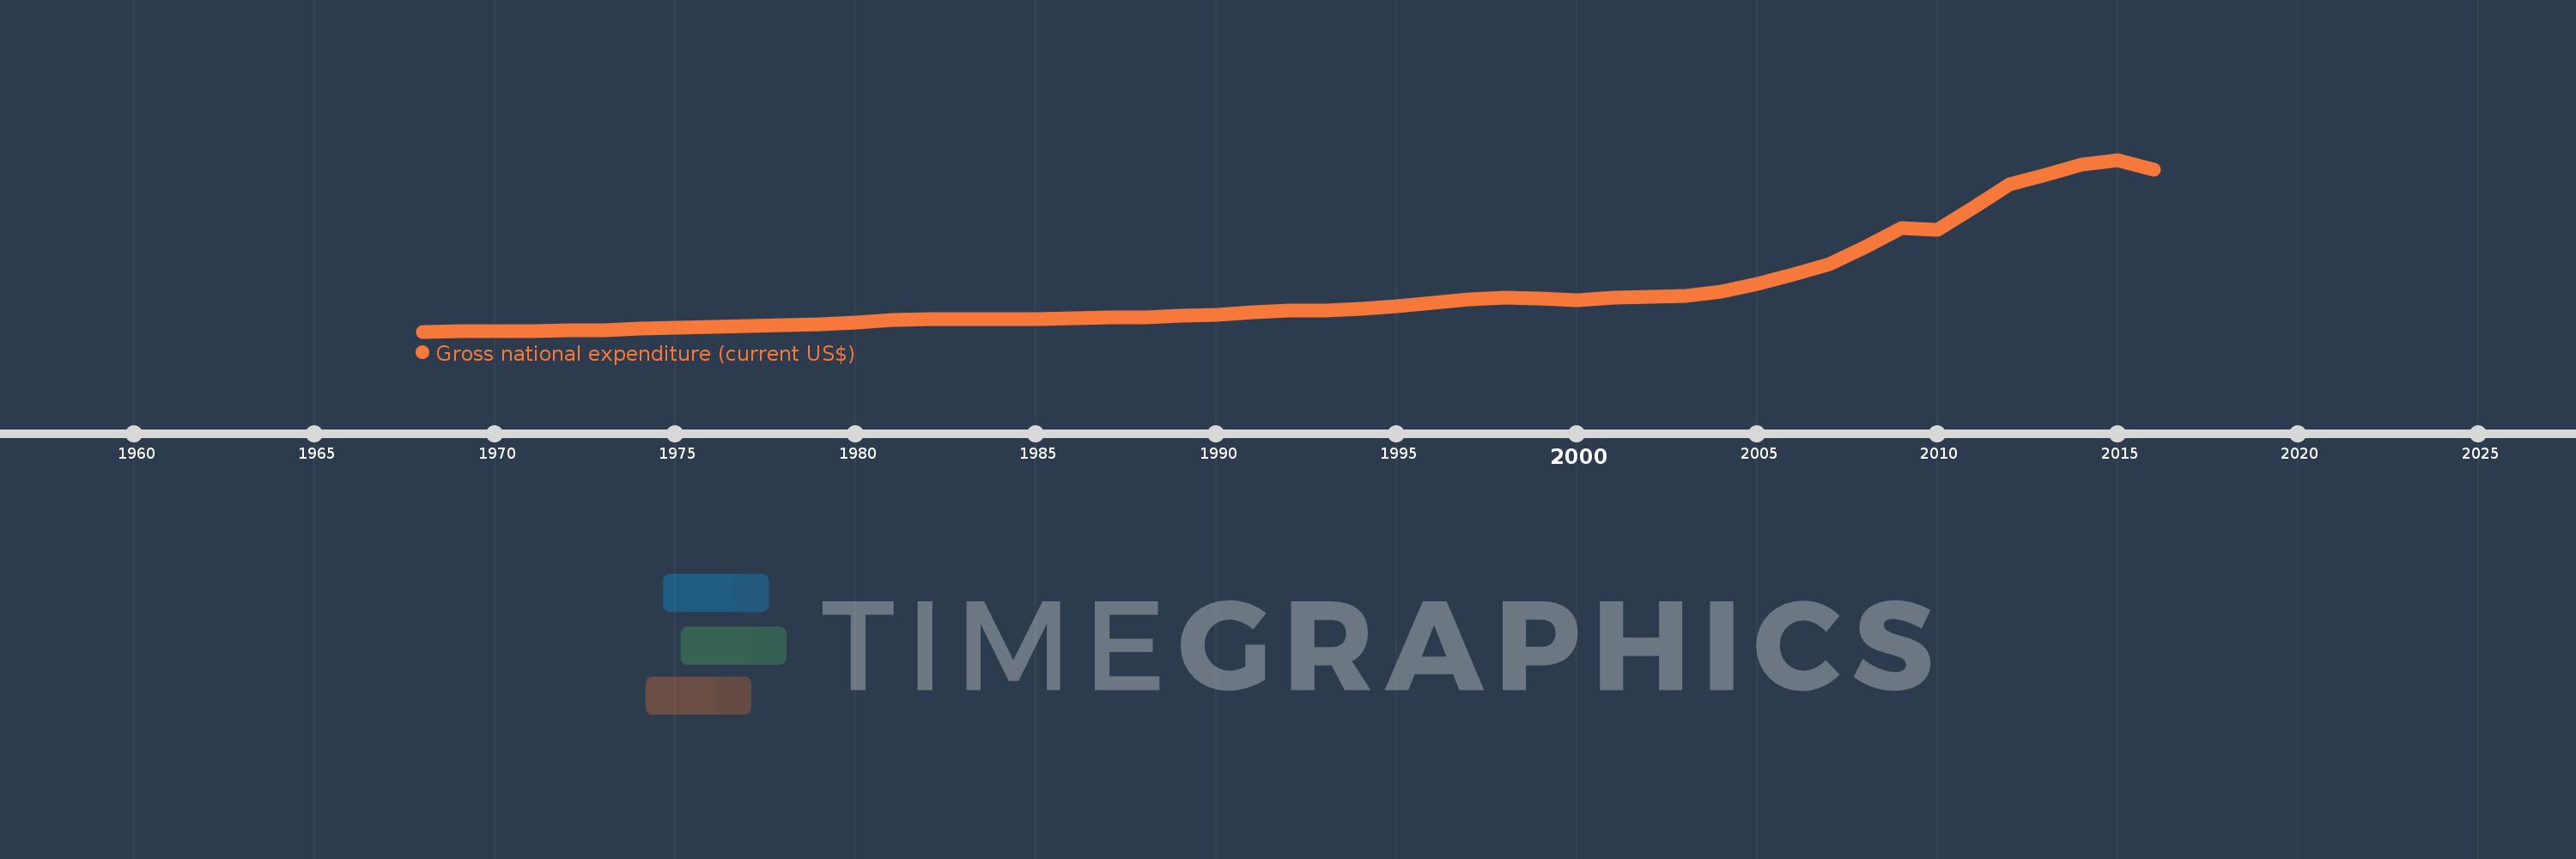
Gross national expenditure (current US$)
2016,2015,2014,2013,2012,2011,2010,2009,2008,2007,2006,2005,2004,2003,2002,2001,2000,1999,1998,1997,1996,1995,1994,1993,1992,1991,1990,1989,1988,1987,1986,1985,1984,1983,1982,1981,1980,1979,1978,1977,1976,1975,1974,1973,1972,1971,1970,1969,1968
Estas estadísticas en otros países:
AfghanistanAlbaniaAlgeriaAngolaAntigua and BarbudaArab WorldArgentinaArmeniaArubaAustraliaAustriaAzerbaijanBahamas, TheBahrainBangladeshBarbadosBelarusBelgiumBelizeBeninBermudaBhutanBoliviaBosnia and HerzegovinaBotswanaBrazilBrunei DarussalamBulgariaBurkina FasoBurundiCabo VerdeCambodiaCameroonCanadaCaribbean small statesCentral African RepublicCentral Europe and the BalticsChadChileChinaColombiaComorosCongo, Dem. Rep.Congo, Rep.Costa RicaCote d'IvoireCroatiaCubaCyprusCzech RepublicDenmarkDjiboutiDominicaDominican RepublicEarly-demographic dividendEast Asia & PacificEast Asia & Pacific (excluding high income)East Asia & Pacific (IDA & IBRD countries)EcuadorEgypt, Arab Rep.El SalvadorEquatorial GuineaEritreaEstoniaEthiopiaEuro areaEurope & Central AsiaEurope & Central Asia (excluding high income)Europe & Central Asia (IDA & IBRD countries)European UnionFaroe IslandsFijiFinlandFragile and conflict affected situationsFranceFrench PolynesiaGabonGambia, TheGeorgiaGermanyGhanaGreeceGrenadaGuatemalaGuineaGuinea-BissauGuyanaHaitiHeavily indebted poor countries (HIPC)High incomeHondurasHong Kong SAR, ChinaHungaryIBRD onlyIcelandIDA & IBRD totalIDA blendIDA onlyIDA totalIndiaIndonesiaIran, Islamic Rep.IraqIrelandIsraelItalyJamaicaJapanJordanKazakhstanKenyaKiribatiKorea, Rep.KosovoKuwaitKyrgyz RepublicLao PDRLate-demographic dividendLatin America & Caribbean Latin America & Caribbean (excluding high income)Latin America & the Caribbean (IDA & IBRD countries)LatviaLeast developed countries: UN classificationLebanonLesothoLiberiaLibyaLithuaniaLow & middle incomeLow incomeLower middle incomeLuxembourgMacao SAR, ChinaMacedonia, FYRMadagascarMalawiMalaysiaMaldivesMaliMaltaMauritaniaMauritiusMexicoMicronesia, Fed. Sts.Middle East & North AfricaMiddle East & North Africa (excluding high income)Middle East & North Africa (IDA & IBRD countries)Middle incomeMoldovaMongoliaMontenegroMoroccoMozambiqueMyanmarNamibiaNepalNetherlandsNew CaledoniaNew ZealandNicaraguaNigerNigeriaNorth AmericaNorwayOECD membersOmanOther small statesPacific island small statesPakistanPalauPanamaPapua New GuineaParaguayPeruPhilippinesPolandPortugalPost-demographic dividendPre-demographic dividendPuerto RicoQatarRomaniaRussian FederationRwandaSamoaSaudi ArabiaSenegalSerbiaSeychellesSierra LeoneSingaporeSlovak RepublicSloveniaSmall statesSolomon IslandsSomaliaSouth AfricaSouth AsiaSouth Asia (IDA & IBRD)South SudanSpainSri LankaSt. Kitts and NevisSt. LuciaSt. Vincent and the GrenadinesSub-Saharan Africa Sub-Saharan Africa (excluding high income)Sub-Saharan Africa (IDA & IBRD countries)SudanSurinameSwazilandSwedenSwitzerlandSyrian Arab RepublicTajikistanTanzaniaThailandTimor-LesteTogoTongaTrinidad and TobagoTunisiaTurkeyTurkmenistanUgandaUkraineUnited Arab EmiratesUnited KingdomUnited StatesUpper middle incomeUruguayUzbekistanVanuatuVenezuela, RBVietnamWest Bank and GazaWorldYemen, Rep.ZambiaZimbabwe línea de tiempo (timeline):
En esta escala de tiempo se presenta un gráfico de 1968 y 2016 de IDA & IBRD total. Los datos de 1967 están ausentes. El número de observaciones reales por fecha: 49.
Fuente (nombre):
Indicadores del desarrollo mundial
Fuente (organización):
World Bank national accounts data, and OECD National Accounts data files.
Categorías:
Economy & Growth
Se ha actualizado:
23 abr 2017 año
Los indicadores de los cambios de valor en los últimos años
En promedio:
7.181 billones
Mínimo:
457.858 bn
1 ene 1968 año
Máximo:
29.003 billones
1 ene 2015 año
A la fecha de observación
Valor
Cambio absoluto
El cambio con respecto al valor anterior
1 ene 1968 año
457.858 bn
+457.858 bn
0.0%
1 ene 1969 año
478.774 bn
+20.917 bn
4.57%
1 ene 1970 año
532.627 bn
+53.853 bn
11.25%
1 ene 1971 año
589.321 bn
+56.694 bn
10.64%
1 ene 1972 año
632.261 bn
+42.94 bn
7.29%
1 ene 1973 año
710.609 bn
+78.348 bn
12.39%
1 ene 1974 año
890.095 bn
+179.486 bn
25.26%
1 ene 1975 año
1.115 billones
+225.046 bn
25.28%
1 ene 1976 año
1.261 billones
+145.648 bn
13.06%
1 ene 1977 año
1.329 billones
+68.002 bn
5.39%
1 ene 1978 año
1.5 billones
+171.151 bn
12.88%
1 ene 1979 año
1.619 billones
+119.312 bn
7.95%
1 ene 1980 año
1.916 billones
+297.216 bn
18.36%
1 ene 1981 año
2.318 billones
+401.541 bn
20.95%
1 ene 1982 año
2.577 billones
+259.234 bn
11.18%
1 ene 1983 año
2.485 billones
-91.797 bn
-3.56%
1 ene 1984 año
2.524 billones
+38.495 bn
1.55%
1 ene 1985 año
2.518 billones
-6.367 bn
-0.25%
1 ene 1986 año
2.673 billones
+155.828 bn
6.19%
1 ene 1987 año
2.81 billones
+136.222 bn
5.1%
1 ene 1988 año
2.844 billones
+34.603 bn
1.23%
1 ene 1989 año
3.087 billones
+242.335 bn
8.52%
1 ene 1990 año
3.277 billones
+190.889 bn
6.18%
1 ene 1991 año
3.718 billones
+440.464 bn
13.44%
1 ene 1992 año
4.016 billones
+298.032 bn
8.02%
1 ene 1993 año
3.969 billones
-47.105 bn
-1.17%
1 ene 1994 año
4.306 billones
+337.141 bn
8.49%
1 ene 1995 año
4.68 billones
+374.476 bn
8.7%
1 ene 1996 año
5.27 billones
+589.71 bn
12.6%
1 ene 1997 año
5.748 billones
+478.02 bn
9.07%
1 ene 1998 año
6.094 billones
+345.425 bn
6.01%
1 ene 1999 año
5.889 billones
-204.949 bn
-3.36%
1 ene 2000 año
5.669 billones
-219.624 bn
-3.73%
1 ene 2001 año
6.126 billones
+457.026 bn
8.06%
1 ene 2002 año
6.239 billones
+112.661 bn
1.84%
1 ene 2003 año
6.322 billones
+83.1 bn
1.33%
1 ene 2004 año
7.12 billones
+797.995 bn
12.62%
1 ene 2005 año
8.433 billones
+1.313 billones
18.45%
1 ene 2006 año
9.938 billones
+1.505 billones
17.84%
1 ene 2007 año
11.666 billones
+1.728 billones
17.39%
1 ene 2008 año
14.573 billones
+2.907 billones
24.92%
1 ene 2009 año
17.629 billones
+3.056 billones
20.97%
1 ene 2010 año
17.345 billones
-284.391 bn
-1.61%
1 ene 2011 año
21.057 billones
+3.713 billones
21.41%
1 ene 2012 año
24.91 billones
+3.853 billones
18.3%
1 ene 2013 año
26.498 billones
+1.588 billones
6.37%
1 ene 2014 año
28.162 billones
+1.664 billones
6.28%
1 ene 2015 año
29.003 billones
+840.746 bn
2.99%
1 ene 2016 año
27.334 billones
-1.668 billones
-5.75%
Ranking de los países por los datos estadísticos actuales


Comentarios: