29
/es/
es
AIzaSyAYiBZKx7MnpbEhh9jyipgxe19OcubqV5w
April 1, 2024
161538
Italy
ITA
true
2
1
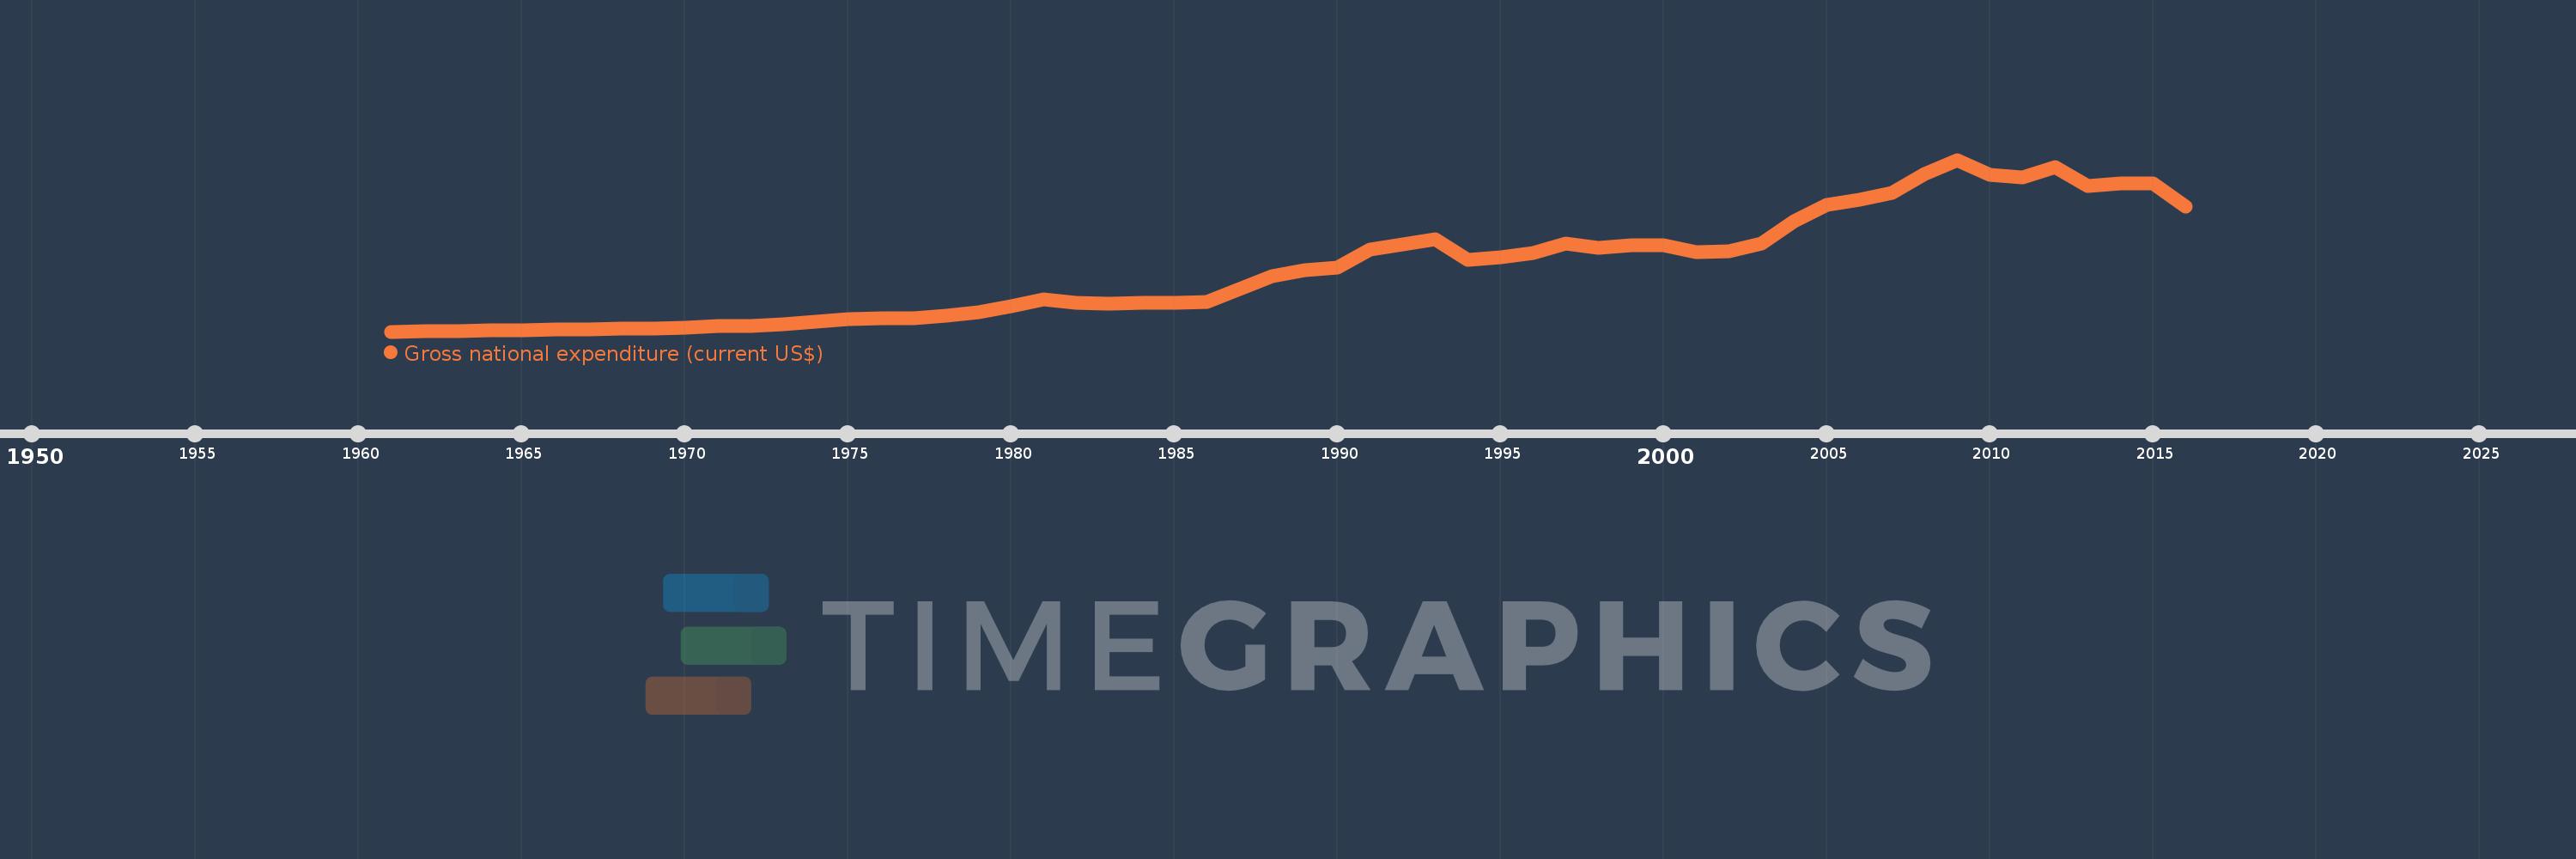
Gross national expenditure (current US$)
2016,2015,2014,2013,2012,2011,2010,2009,2008,2007,2006,2005,2004,2003,2002,2001,2000,1999,1998,1997,1996,1995,1994,1993,1992,1991,1990,1989,1988,1987,1986,1985,1984,1983,1982,1981,1980,1979,1978,1977,1976,1975,1974,1973,1972,1971,1970,1969,1968,1967,1966,1965,1964,1963,1962,1961
Estas estadísticas en otros países:
AfghanistanAlbaniaAlgeriaAngolaAntigua and BarbudaArab WorldArgentinaArmeniaArubaAustraliaAustriaAzerbaijanBahamas, TheBahrainBangladeshBarbadosBelarusBelgiumBelizeBeninBermudaBhutanBoliviaBosnia and HerzegovinaBotswanaBrazilBrunei DarussalamBulgariaBurkina FasoBurundiCabo VerdeCambodiaCameroonCanadaCaribbean small statesCentral African RepublicCentral Europe and the BalticsChadChileChinaColombiaComorosCongo, Dem. Rep.Congo, Rep.Costa RicaCote d'IvoireCroatiaCubaCyprusCzech RepublicDenmarkDjiboutiDominicaDominican RepublicEarly-demographic dividendEast Asia & PacificEast Asia & Pacific (excluding high income)East Asia & Pacific (IDA & IBRD countries)EcuadorEgypt, Arab Rep.El SalvadorEquatorial GuineaEritreaEstoniaEthiopiaEuro areaEurope & Central AsiaEurope & Central Asia (excluding high income)Europe & Central Asia (IDA & IBRD countries)European UnionFaroe IslandsFijiFinlandFragile and conflict affected situationsFranceFrench PolynesiaGabonGambia, TheGeorgiaGermanyGhanaGreeceGrenadaGuatemalaGuineaGuinea-BissauGuyanaHaitiHeavily indebted poor countries (HIPC)High incomeHondurasHong Kong SAR, ChinaHungaryIBRD onlyIcelandIDA & IBRD totalIDA blendIDA onlyIDA totalIndiaIndonesiaIran, Islamic Rep.IraqIrelandIsraelItalyJamaicaJapanJordanKazakhstanKenyaKiribatiKorea, Rep.KosovoKuwaitKyrgyz RepublicLao PDRLate-demographic dividendLatin America & Caribbean Latin America & Caribbean (excluding high income)Latin America & the Caribbean (IDA & IBRD countries)LatviaLeast developed countries: UN classificationLebanonLesothoLiberiaLibyaLithuaniaLow & middle incomeLow incomeLower middle incomeLuxembourgMacao SAR, ChinaMacedonia, FYRMadagascarMalawiMalaysiaMaldivesMaliMaltaMauritaniaMauritiusMexicoMicronesia, Fed. Sts.Middle East & North AfricaMiddle East & North Africa (excluding high income)Middle East & North Africa (IDA & IBRD countries)Middle incomeMoldovaMongoliaMontenegroMoroccoMozambiqueMyanmarNamibiaNepalNetherlandsNew CaledoniaNew ZealandNicaraguaNigerNigeriaNorth AmericaNorwayOECD membersOmanOther small statesPacific island small statesPakistanPalauPanamaPapua New GuineaParaguayPeruPhilippinesPolandPortugalPost-demographic dividendPre-demographic dividendPuerto RicoQatarRomaniaRussian FederationRwandaSamoaSaudi ArabiaSenegalSerbiaSeychellesSierra LeoneSingaporeSlovak RepublicSloveniaSmall statesSolomon IslandsSomaliaSouth AfricaSouth AsiaSouth Asia (IDA & IBRD)South SudanSpainSri LankaSt. Kitts and NevisSt. LuciaSt. Vincent and the GrenadinesSub-Saharan Africa Sub-Saharan Africa (excluding high income)Sub-Saharan Africa (IDA & IBRD countries)SudanSurinameSwazilandSwedenSwitzerlandSyrian Arab RepublicTajikistanTanzaniaThailandTimor-LesteTogoTongaTrinidad and TobagoTunisiaTurkeyTurkmenistanUgandaUkraineUnited Arab EmiratesUnited KingdomUnited StatesUpper middle incomeUruguayUzbekistanVanuatuVenezuela, RBVietnamWest Bank and GazaWorldYemen, Rep.ZambiaZimbabwe línea de tiempo (timeline):
En esta escala de tiempo se presenta un gráfico de 1961 y 2016 de Italy. Los datos de 1960 están ausentes. El número de observaciones reales por fecha: 56.
Fuente (nombre):
Indicadores del desarrollo mundial
Fuente (organización):
World Bank national accounts data, and OECD National Accounts data files.
Categorías:
Economy & Growth
Se ha actualizado:
23 abr 2017 año
Los indicadores de los cambios de valor en los últimos años
Mínimo:
40.533 bn
1 ene 1961 año
Máximo:
2.41 billones
1 ene 2009 año
A la fecha de observación
Valor
Cambio absoluto
El cambio con respecto al valor anterior
1 ene 1961 año
40.533 bn
+40.533 bn
0.0%
1 ene 1962 año
44.874 bn
+4.341 bn
10.71%
1 ene 1963 año
50.653 bn
+5.779 bn
12.88%
1 ene 1964 año
58.968 bn
+8.315 bn
16.42%
1 ene 1965 año
63.109 bn
+4.141 bn
7.02%
1 ene 1966 año
66.508 bn
+3.399 bn
5.39%
1 ene 1967 año
72.409 bn
+5.901 bn
8.87%
1 ene 1968 año
80.351 bn
+7.941 bn
10.97%
1 ene 1969 año
86.212 bn
+5.861 bn
7.29%
1 ene 1970 año
95.825 bn
+9.613 bn
11.15%
1 ene 1971 año
112.761 bn
+16.936 bn
17.67%
1 ene 1972 año
123.307 bn
+10.546 bn
9.35%
1 ene 1973 año
143.611 bn
+20.304 bn
16.47%
1 ene 1974 año
178.163 bn
+34.552 bn
24.06%
1 ene 1975 año
206.394 bn
+28.231 bn
15.85%
1 ene 1976 año
226.795 bn
+20.401 bn
9.88%
1 ene 1977 año
226.449 bn
-345.82 millones
-0.15%
1 ene 1978 año
254.295 bn
+27.846 bn
12.3%
1 ene 1979 año
307.432 bn
+53.136 bn
20.9%
1 ene 1980 año
388.198 bn
+80.766 bn
26.27%
1 ene 1981 año
488.08 bn
+99.882 bn
25.73%
1 ene 1982 año
437.675 bn
-50.405 bn
-10.33%
1 ene 1983 año
431.272 bn
-6.403 bn
-1.46%
1 ene 1984 año
439.463 bn
+8.191 bn
1.9%
1 ene 1985 año
438.301 bn
-1.162 bn
-0.26%
1 ene 1986 año
452.579 bn
+14.278 bn
3.26%
1 ene 1987 año
630.295 bn
+177.716 bn
39.27%
1 ene 1988 año
799.775 bn
+169.48 bn
26.89%
1 ene 1989 año
888.252 bn
+88.477 bn
11.06%
1 ene 1990 año
925.761 bn
+37.509 bn
4.22%
1 ene 1991 año
1.175 billones
+249.215 bn
26.92%
1 ene 1992 año
1.24 billones
+64.7 bn
5.51%
1 ene 1993 año
1.315 billones
+75.518 bn
6.09%
1 ene 1994 año
1.029 billones
-286.125 bn
-21.76%
1 ene 1995 año
1.059 billones
+30.375 bn
2.95%
1 ene 1996 año
1.128 billones
+68.329 bn
6.45%
1 ene 1997 año
1.249 billones
+121.691 bn
10.79%
1 ene 1998 año
1.193 billones
-56.492 bn
-4.52%
1 ene 1999 año
1.228 billones
+34.899 bn
2.93%
1 ene 2000 año
1.226 billones
-1.481 bn
-0.12%
1 ene 2001 año
1.132 billones
-94.234 bn
-7.68%
1 ene 2002 año
1.148 billones
+15.57 bn
1.38%
1 ene 2003 año
1.257 billones
+109.336 bn
9.53%
1 ene 2004 año
1.563 billones
+305.479 bn
24.3%
1 ene 2005 año
1.788 billones
+225.304 bn
14.42%
1 ene 2006 año
1.855 billones
+66.863 bn
3.74%
1 ene 2007 año
1.959 billones
+104.172 bn
5.62%
1 ene 2008 año
2.211 billones
+252.087 bn
12.87%
1 ene 2009 año
2.41 billones
+198.622 bn
8.98%
1 ene 2010 año
2.199 billones
-210.097 bn
-8.72%
1 ene 2011 año
2.167 billones
-32.46 bn
-1.48%
1 ene 2012 año
2.312 billones
+144.86 bn
6.68%
1 ene 2013 año
2.052 billones
-259.546 bn
-11.23%
1 ene 2014 año
2.082 billones
+30.026 bn
1.46%
1 ene 2015 año
2.088 billones
+6.02 bn
0.29%
1 ene 2016 año
1.765 billones
-322.935 bn
-15.46%
Ranking de los países por los datos estadísticos actuales


Comentarios: