29
/es/
es
AIzaSyAYiBZKx7MnpbEhh9jyipgxe19OcubqV5w
April 1, 2024
56431
Small states
SST
false
2
1
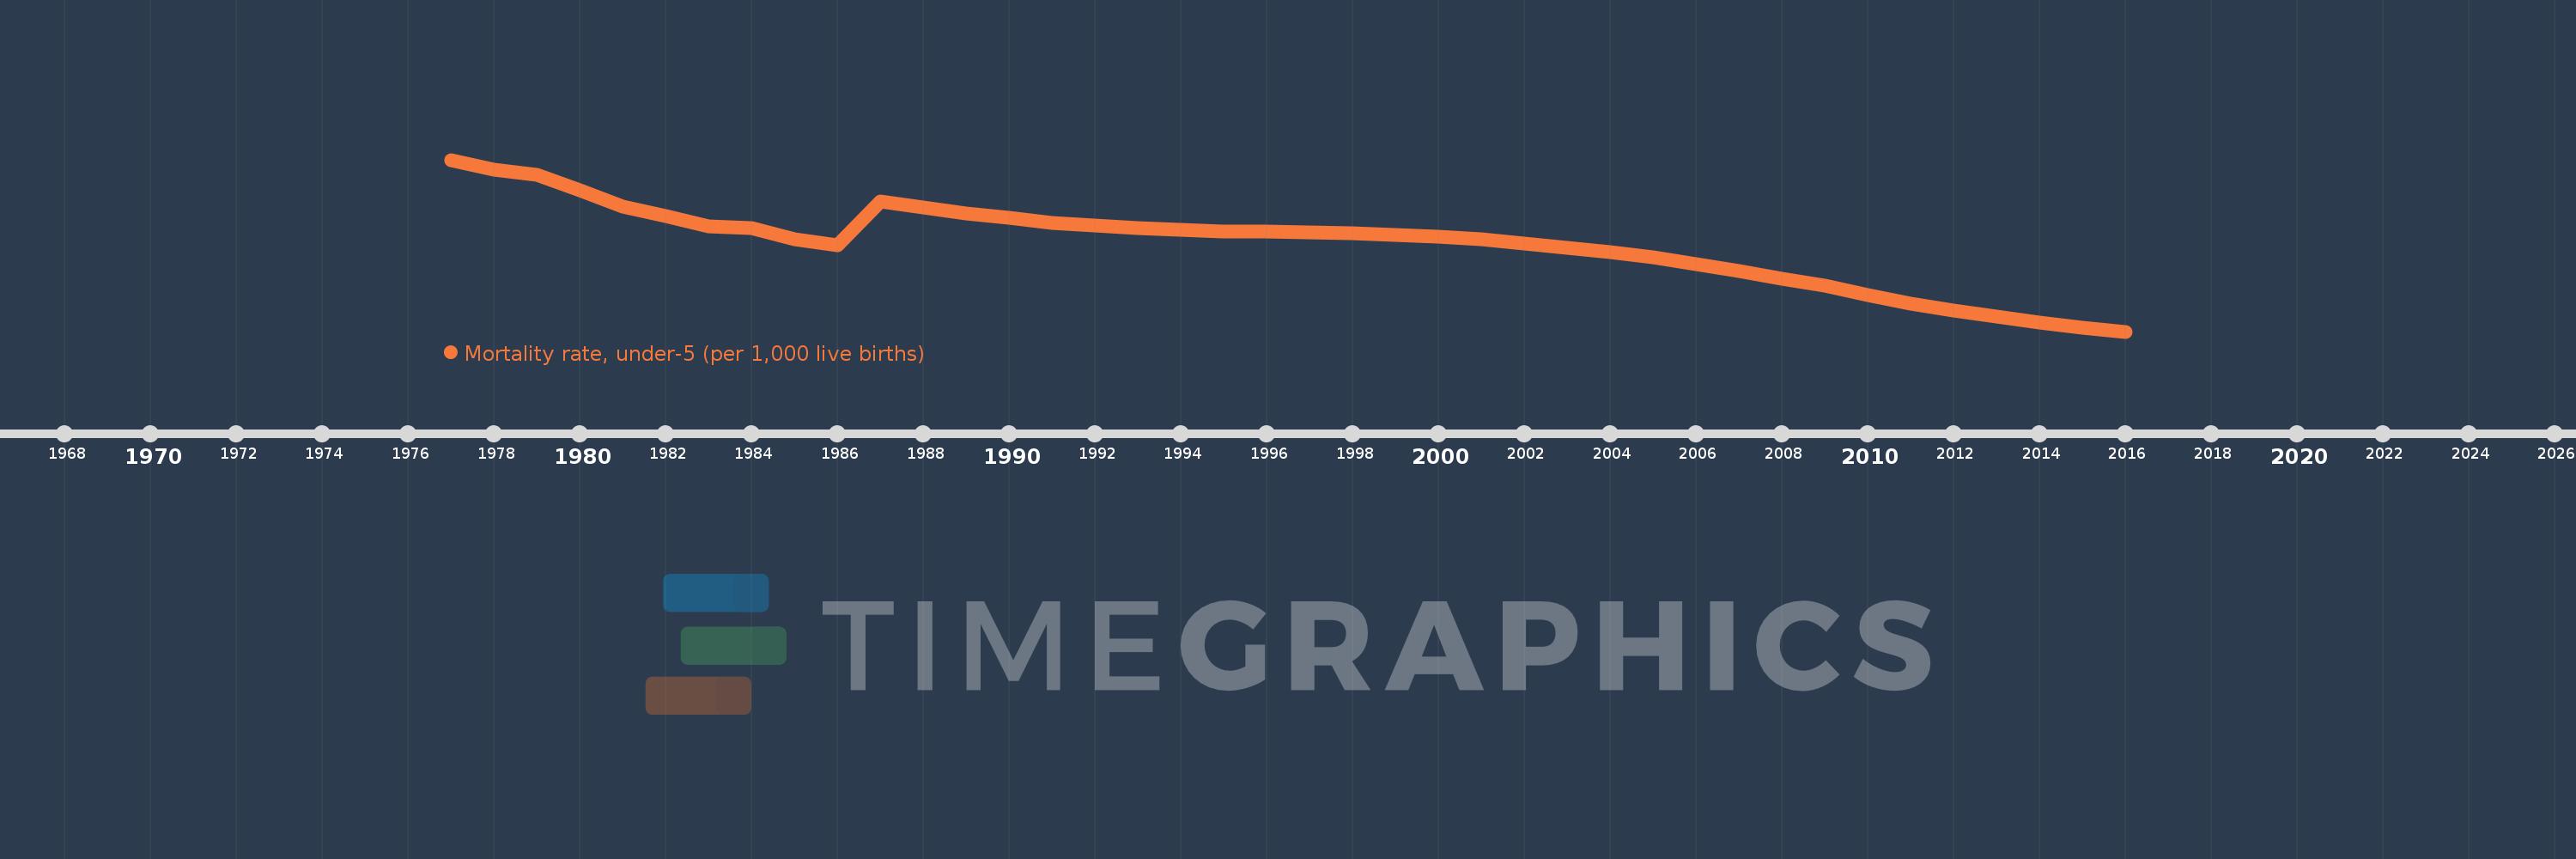
Mortality rate, under-5 (per 1,000 live births)
2016,2015,2014,2013,2012,2011,2010,2009,2008,2007,2006,2005,2004,2003,2002,2001,2000,1999,1998,1997,1996,1995,1994,1993,1992,1991,1990,1989,1988,1987,1986,1985,1984,1983,1982,1981,1980,1979,1978,1977
Estas estadísticas en otros países:
AfghanistanAlbaniaAlgeriaAndorraAngolaAntigua and BarbudaArab WorldArgentinaArmeniaAustraliaAustriaAzerbaijanBahamas, TheBahrainBangladeshBarbadosBelarusBelgiumBelizeBeninBhutanBoliviaBosnia and HerzegovinaBotswanaBrazilBrunei DarussalamBulgariaBurkina FasoBurundiCabo VerdeCambodiaCameroonCanadaCaribbean small statesCentral African RepublicCentral Europe and the BalticsChadChileChinaColombiaComorosCongo, Dem. Rep.Congo, Rep.Costa RicaCote d'IvoireCroatiaCubaCyprusCzech RepublicDenmarkDjiboutiDominicaDominican RepublicEarly-demographic dividendEast Asia & PacificEast Asia & Pacific (excluding high income)East Asia & Pacific (IDA & IBRD countries)EcuadorEgypt, Arab Rep.El SalvadorEquatorial GuineaEritreaEstoniaEthiopiaEuro areaEurope & Central AsiaEurope & Central Asia (excluding high income)Europe & Central Asia (IDA & IBRD countries)European UnionFijiFinlandFragile and conflict affected situationsFranceGabonGambia, TheGeorgiaGermanyGhanaGreeceGrenadaGuatemalaGuineaGuinea-BissauGuyanaHaitiHeavily indebted poor countries (HIPC)High incomeHondurasHungaryIBRD onlyIcelandIDA & IBRD totalIDA blendIDA onlyIDA totalIndiaIndonesiaIran, Islamic Rep.IraqIrelandIsraelItalyJamaicaJapanJordanKazakhstanKenyaKiribatiKorea, Dem. People’s Rep.Korea, Rep.KuwaitKyrgyz RepublicLao PDRLate-demographic dividendLatin America & Caribbean Latin America & Caribbean (excluding high income)Latin America & the Caribbean (IDA & IBRD countries)LatviaLeast developed countries: UN classificationLebanonLesothoLiberiaLibyaLithuaniaLow & middle incomeLow incomeLower middle incomeLuxembourgMacedonia, FYRMadagascarMalawiMalaysiaMaldivesMaliMaltaMarshall IslandsMauritaniaMauritiusMexicoMicronesia, Fed. Sts.Middle East & North AfricaMiddle East & North Africa (excluding high income)Middle East & North Africa (IDA & IBRD countries)Middle incomeMoldovaMonacoMongoliaMontenegroMoroccoMozambiqueMyanmarNamibiaNauruNepalNetherlandsNew ZealandNicaraguaNigerNigeriaNorth AmericaNorwayOECD membersOmanOther small statesPacific island small statesPakistanPalauPanamaPapua New GuineaParaguayPeruPhilippinesPolandPortugalPost-demographic dividendPre-demographic dividendQatarRomaniaRussian FederationRwandaSamoaSan MarinoSao Tome and PrincipeSaudi ArabiaSenegalSerbiaSeychellesSierra LeoneSingaporeSlovak RepublicSloveniaSmall statesSolomon IslandsSomaliaSouth AfricaSouth AsiaSouth Asia (IDA & IBRD)South SudanSpainSri LankaSt. Kitts and NevisSt. LuciaSt. Vincent and the GrenadinesSub-Saharan Africa Sub-Saharan Africa (excluding high income)Sub-Saharan Africa (IDA & IBRD countries)SudanSurinameSwazilandSwedenSwitzerlandSyrian Arab RepublicTajikistanTanzaniaThailandTimor-LesteTogoTongaTrinidad and TobagoTunisiaTurkeyTurkmenistanTuvaluUgandaUkraineUnited Arab EmiratesUnited KingdomUnited StatesUpper middle incomeUruguayUzbekistanVanuatuVenezuela, RBVietnamWest Bank and GazaWorldYemen, Rep.ZambiaZimbabwe línea de tiempo (timeline):
En esta escala de tiempo se presenta un gráfico de 1977 y 2016 de Small states. Los datos de 1976 están ausentes. El número de observaciones reales por fecha: 40.
Fuente (nombre):
Indicadores del desarrollo mundial
Fuente (organización):
Estimates Developed by the UN Inter-agency Group for Child Mortality Estimation (UNICEF, WHO, World Bank, UN DESA Population Division) at www.childmortality.org. Projected data are from the United Nations Population Division's World Population Prospects; and may in some cases not be consistent with data before the current year.
Categorías:
Health, Aid Effectiveness, Climate Change
Se ha actualizado:
23 abr 2017 año
Los indicadores de los cambios de valor en los últimos años
Mínimo:
48.332
1 ene 2016 año
Máximo:
102.653
1 ene 1977 año
A la fecha de observación
Valor
Cambio absoluto
El cambio con respecto al valor anterior
1 ene 1977 año
102.653
+102.653
0.0%
1 ene 1978 año
99.426
-3.227
-3.14%
1 ene 1979 año
97.848
-1.578
-1.59%
1 ene 1980 año
93.077
-4.771
-4.88%
1 ene 1981 año
87.718
-5.359
-5.76%
1 ene 1982 año
84.859
-2.859
-3.26%
1 ene 1983 año
81.495
-3.364
-3.96%
1 ene 1984 año
81.16
-0.335
-0.41%
1 ene 1985 año
77.546
-3.615
-4.45%
1 ene 1986 año
75.606
-1.939
-2.5%
1 ene 1987 año
89.484
+13.878
18.36%
1 ene 1988 año
87.56
-1.925
-2.15%
1 ene 1989 año
85.754
-1.806
-2.06%
1 ene 1990 año
84.201
-1.553
-1.81%
1 ene 1991 año
82.807
-1.394
-1.66%
1 ene 1992 año
81.757
-1.05
-1.27%
1 ene 1993 año
80.969
-0.789
-0.96%
1 ene 1994 año
80.427
-0.542
-0.67%
1 ene 1995 año
80.088
-0.339
-0.42%
1 ene 1996 año
79.925
-0.163
-0.2%
1 ene 1997 año
79.726
-0.199
-0.25%
1 ene 1998 año
79.423
-0.302
-0.38%
1 ene 1999 año
78.881
-0.543
-0.68%
1 ene 2000 año
78.267
-0.614
-0.78%
1 ene 2001 año
77.417
-0.85
-1.09%
1 ene 2002 año
76.236
-1.182
-1.53%
1 ene 2003 año
74.909
-1.327
-1.74%
1 ene 2004 año
73.483
-1.426
-1.9%
1 ene 2005 año
71.856
-1.627
-2.21%
1 ene 2006 año
69.727
-2.129
-2.96%
1 ene 2007 año
67.377
-2.351
-3.37%
1 ene 2008 año
65.047
-2.33
-3.46%
1 ene 2009 año
62.966
-2.081
-3.2%
1 ene 2010 año
59.999
-2.967
-4.71%
1 ene 2011 año
57.136
-2.862
-4.77%
1 ene 2012 año
54.944
-2.192
-3.84%
1 ene 2013 año
53.019
-1.925
-3.5%
1 ene 2014 año
51.264
-1.755
-3.31%
1 ene 2015 año
49.65
-1.614
-3.15%
1 ene 2016 año
48.332
-1.317
-2.65%
Ranking de los países por los datos estadísticos actuales


Comentarios: