29
/es/
es
AIzaSyAYiBZKx7MnpbEhh9jyipgxe19OcubqV5w
April 1, 2024
38379
IDA blend
IDB
false
2
1
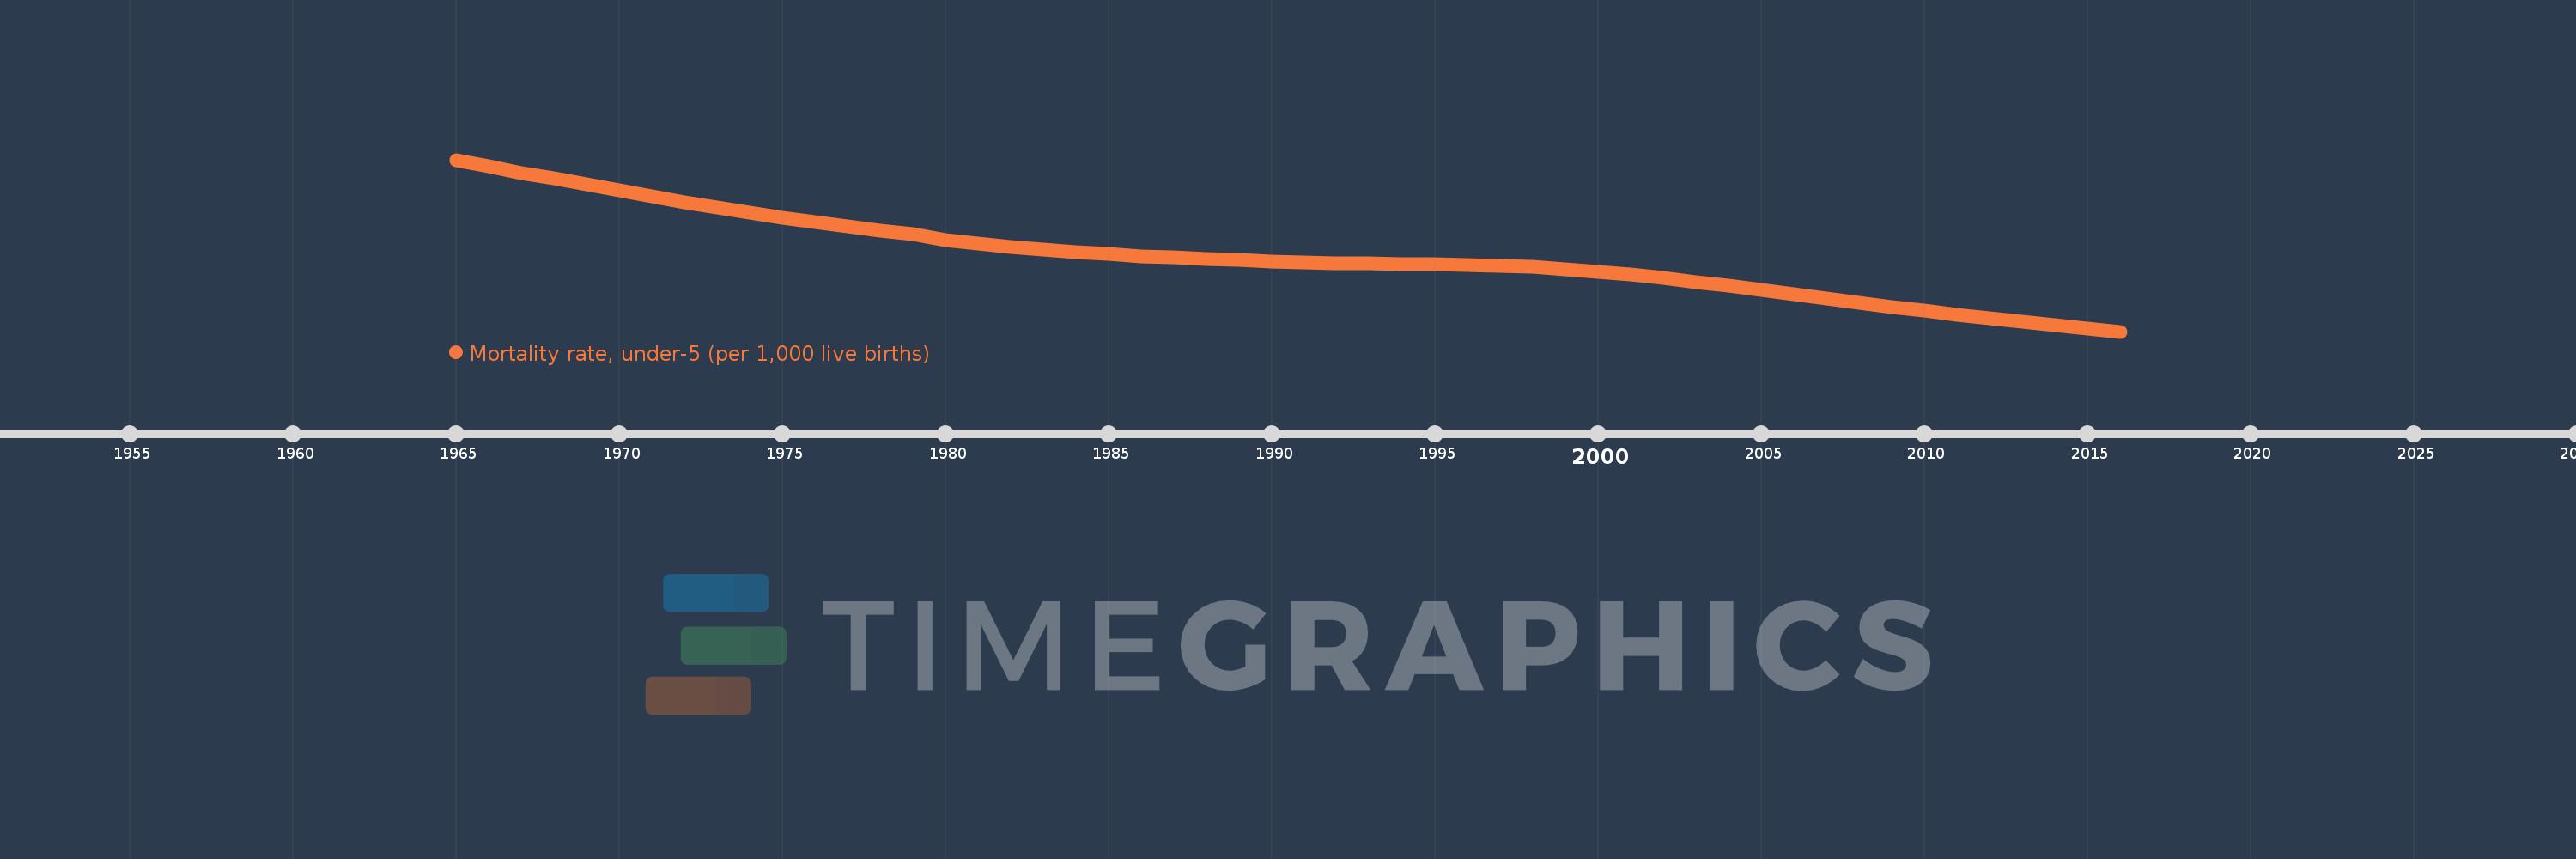
Mortality rate, under-5 (per 1,000 live births)
2016,2015,2014,2013,2012,2011,2010,2009,2008,2007,2006,2005,2004,2003,2002,2001,2000,1999,1998,1997,1996,1995,1994,1993,1992,1991,1990,1989,1988,1987,1986,1985,1984,1983,1982,1981,1980,1979,1978,1977,1976,1975,1974,1973,1972,1971,1970,1969,1968,1967,1966,1965
Estas estadísticas en otros países:
AfghanistanAlbaniaAlgeriaAndorraAngolaAntigua and BarbudaArab WorldArgentinaArmeniaAustraliaAustriaAzerbaijanBahamas, TheBahrainBangladeshBarbadosBelarusBelgiumBelizeBeninBhutanBoliviaBosnia and HerzegovinaBotswanaBrazilBrunei DarussalamBulgariaBurkina FasoBurundiCabo VerdeCambodiaCameroonCanadaCaribbean small statesCentral African RepublicCentral Europe and the BalticsChadChileChinaColombiaComorosCongo, Dem. Rep.Congo, Rep.Costa RicaCote d'IvoireCroatiaCubaCyprusCzech RepublicDenmarkDjiboutiDominicaDominican RepublicEarly-demographic dividendEast Asia & PacificEast Asia & Pacific (excluding high income)East Asia & Pacific (IDA & IBRD countries)EcuadorEgypt, Arab Rep.El SalvadorEquatorial GuineaEritreaEstoniaEthiopiaEuro areaEurope & Central AsiaEurope & Central Asia (excluding high income)Europe & Central Asia (IDA & IBRD countries)European UnionFijiFinlandFragile and conflict affected situationsFranceGabonGambia, TheGeorgiaGermanyGhanaGreeceGrenadaGuatemalaGuineaGuinea-BissauGuyanaHaitiHeavily indebted poor countries (HIPC)High incomeHondurasHungaryIBRD onlyIcelandIDA & IBRD totalIDA blendIDA onlyIDA totalIndiaIndonesiaIran, Islamic Rep.IraqIrelandIsraelItalyJamaicaJapanJordanKazakhstanKenyaKiribatiKorea, Dem. People’s Rep.Korea, Rep.KuwaitKyrgyz RepublicLao PDRLate-demographic dividendLatin America & Caribbean Latin America & Caribbean (excluding high income)Latin America & the Caribbean (IDA & IBRD countries)LatviaLeast developed countries: UN classificationLebanonLesothoLiberiaLibyaLithuaniaLow & middle incomeLow incomeLower middle incomeLuxembourgMacedonia, FYRMadagascarMalawiMalaysiaMaldivesMaliMaltaMarshall IslandsMauritaniaMauritiusMexicoMicronesia, Fed. Sts.Middle East & North AfricaMiddle East & North Africa (excluding high income)Middle East & North Africa (IDA & IBRD countries)Middle incomeMoldovaMonacoMongoliaMontenegroMoroccoMozambiqueMyanmarNamibiaNauruNepalNetherlandsNew ZealandNicaraguaNigerNigeriaNorth AmericaNorwayOECD membersOmanOther small statesPacific island small statesPakistanPalauPanamaPapua New GuineaParaguayPeruPhilippinesPolandPortugalPost-demographic dividendPre-demographic dividendQatarRomaniaRussian FederationRwandaSamoaSan MarinoSao Tome and PrincipeSaudi ArabiaSenegalSerbiaSeychellesSierra LeoneSingaporeSlovak RepublicSloveniaSmall statesSolomon IslandsSomaliaSouth AfricaSouth AsiaSouth Asia (IDA & IBRD)South SudanSpainSri LankaSt. Kitts and NevisSt. LuciaSt. Vincent and the GrenadinesSub-Saharan Africa Sub-Saharan Africa (excluding high income)Sub-Saharan Africa (IDA & IBRD countries)SudanSurinameSwazilandSwedenSwitzerlandSyrian Arab RepublicTajikistanTanzaniaThailandTimor-LesteTogoTongaTrinidad and TobagoTunisiaTurkeyTurkmenistanTuvaluUgandaUkraineUnited Arab EmiratesUnited KingdomUnited StatesUpper middle incomeUruguayUzbekistanVanuatuVenezuela, RBVietnamWest Bank and GazaWorldYemen, Rep.ZambiaZimbabwe línea de tiempo (timeline):
En esta escala de tiempo se presenta un gráfico de 1965 y 2016 de IDA blend. Los datos de 1964 están ausentes. El número de observaciones reales por fecha: 52.
Fuente (nombre):
Indicadores del desarrollo mundial
Fuente (organización):
Estimates Developed by the UN Inter-agency Group for Child Mortality Estimation (UNICEF, WHO, World Bank, UN DESA Population Division) at www.childmortality.org. Projected data are from the United Nations Population Division's World Population Prospects; and may in some cases not be consistent with data before the current year.
Categorías:
Health, Aid Effectiveness, Climate Change
Se ha actualizado:
23 abr 2017 año
Los indicadores de los cambios de valor en los últimos años
Mínimo:
82.344
1 ene 2016 año
Máximo:
221.948
1 ene 1965 año
A la fecha de observación
Valor
Cambio absoluto
El cambio con respecto al valor anterior
1 ene 1965 año
221.948
+221.948
0.0%
1 ene 1966 año
216.543
-5.405
-2.44%
1 ene 1967 año
211.465
-5.078
-2.34%
1 ene 1968 año
206.641
-4.825
-2.28%
1 ene 1969 año
201.92
-4.721
-2.28%
1 ene 1970 año
197.202
-4.717
-2.34%
1 ene 1971 año
192.606
-4.597
-2.33%
1 ene 1972 año
187.201
-5.405
-2.81%
1 ene 1973 año
182.975
-4.226
-2.26%
1 ene 1974 año
178.854
-4.12
-2.25%
1 ene 1975 año
174.962
-3.892
-2.18%
1 ene 1976 año
171.279
-3.683
-2.11%
1 ene 1977 año
167.798
-3.48
-2.03%
1 ene 1978 año
164.467
-3.331
-1.99%
1 ene 1979 año
161.513
-2.954
-1.8%
1 ene 1980 año
157.0
-4.513
-2.79%
1 ene 1981 año
154.025
-2.975
-1.9%
1 ene 1982 año
151.383
-2.642
-1.71%
1 ene 1983 año
149.055
-2.328
-1.54%
1 ene 1984 año
147.047
-2.008
-1.35%
1 ene 1985 año
145.213
-1.834
-1.25%
1 ene 1986 año
143.714
-1.499
-1.03%
1 ene 1987 año
142.585
-1.129
-0.79%
1 ene 1988 año
141.379
-1.205
-0.85%
1 ene 1989 año
140.281
-1.098
-0.78%
1 ene 1990 año
139.365
-0.916
-0.65%
1 ene 1991 año
138.598
-0.767
-0.55%
1 ene 1992 año
138.029
-0.569
-0.41%
1 ene 1993 año
137.682
-0.347
-0.25%
1 ene 1994 año
137.45
-0.232
-0.17%
1 ene 1995 año
137.11
-0.34
-0.25%
1 ene 1996 año
136.679
-0.432
-0.31%
1 ene 1997 año
135.941
-0.738
-0.54%
1 ene 1998 año
134.759
-1.182
-0.87%
1 ene 1999 año
133.124
-1.634
-1.21%
1 ene 2000 año
131.016
-2.108
-1.58%
1 ene 2001 año
128.552
-2.464
-1.88%
1 ene 2002 año
125.697
-2.855
-2.22%
1 ene 2003 año
122.595
-3.101
-2.47%
1 ene 2004 año
119.356
-3.24
-2.64%
1 ene 2005 año
116.349
-3.007
-2.52%
1 ene 2006 año
112.527
-3.822
-3.29%
1 ene 2007 año
109.063
-3.464
-3.08%
1 ene 2008 año
105.638
-3.425
-3.14%
1 ene 2009 año
102.348
-3.289
-3.11%
1 ene 2010 año
99.165
-3.183
-3.11%
1 ene 2011 año
96.028
-3.137
-3.16%
1 ene 2012 año
93.1
-2.928
-3.05%
1 ene 2013 año
90.121
-2.979
-3.2%
1 ene 2014 año
87.357
-2.764
-3.07%
1 ene 2015 año
84.722
-2.635
-3.02%
1 ene 2016 año
82.344
-2.377
-2.81%
Ranking de los países por los datos estadísticos actuales


Comentarios: