29
/es/
es
AIzaSyAYiBZKx7MnpbEhh9jyipgxe19OcubqV5w
April 1, 2024
189270
Maldives
MDV
true
2
1
Mortality rate, under-5 (per 1,000 live births)
2016,2015,2014,2013,2012,2011,2010,2009,2008,2007,2006,2005,2004,2003,2002,2001,2000,1999,1998,1997,1996,1995,1994,1993,1992,1991,1990,1989,1988,1987,1986,1985,1984,1983,1982,1981,1980,1979,1978,1977,1976,1975,1974,1973,1972,1971,1970,1969,1968,1967,1966,1965,1964
Estas estadísticas en otros países:
AfghanistanAlbaniaAlgeriaAndorraAngolaAntigua and BarbudaArab WorldArgentinaArmeniaAustraliaAustriaAzerbaijanBahamas, TheBahrainBangladeshBarbadosBelarusBelgiumBelizeBeninBhutanBoliviaBosnia and HerzegovinaBotswanaBrazilBrunei DarussalamBulgariaBurkina FasoBurundiCabo VerdeCambodiaCameroonCanadaCaribbean small statesCentral African RepublicCentral Europe and the BalticsChadChileChinaColombiaComorosCongo, Dem. Rep.Congo, Rep.Costa RicaCote d'IvoireCroatiaCubaCyprusCzech RepublicDenmarkDjiboutiDominicaDominican RepublicEarly-demographic dividendEast Asia & PacificEast Asia & Pacific (excluding high income)East Asia & Pacific (IDA & IBRD countries)EcuadorEgypt, Arab Rep.El SalvadorEquatorial GuineaEritreaEstoniaEthiopiaEuro areaEurope & Central AsiaEurope & Central Asia (excluding high income)Europe & Central Asia (IDA & IBRD countries)European UnionFijiFinlandFragile and conflict affected situationsFranceGabonGambia, TheGeorgiaGermanyGhanaGreeceGrenadaGuatemalaGuineaGuinea-BissauGuyanaHaitiHeavily indebted poor countries (HIPC)High incomeHondurasHungaryIBRD onlyIcelandIDA & IBRD totalIDA blendIDA onlyIDA totalIndiaIndonesiaIran, Islamic Rep.IraqIrelandIsraelItalyJamaicaJapanJordanKazakhstanKenyaKiribatiKorea, Dem. People’s Rep.Korea, Rep.KuwaitKyrgyz RepublicLao PDRLate-demographic dividendLatin America & Caribbean Latin America & Caribbean (excluding high income)Latin America & the Caribbean (IDA & IBRD countries)LatviaLeast developed countries: UN classificationLebanonLesothoLiberiaLibyaLithuaniaLow & middle incomeLow incomeLower middle incomeLuxembourgMacedonia, FYRMadagascarMalawiMalaysiaMaldivesMaliMaltaMarshall IslandsMauritaniaMauritiusMexicoMicronesia, Fed. Sts.Middle East & North AfricaMiddle East & North Africa (excluding high income)Middle East & North Africa (IDA & IBRD countries)Middle incomeMoldovaMonacoMongoliaMontenegroMoroccoMozambiqueMyanmarNamibiaNauruNepalNetherlandsNew ZealandNicaraguaNigerNigeriaNorth AmericaNorwayOECD membersOmanOther small statesPacific island small statesPakistanPalauPanamaPapua New GuineaParaguayPeruPhilippinesPolandPortugalPost-demographic dividendPre-demographic dividendQatarRomaniaRussian FederationRwandaSamoaSan MarinoSao Tome and PrincipeSaudi ArabiaSenegalSerbiaSeychellesSierra LeoneSingaporeSlovak RepublicSloveniaSmall statesSolomon IslandsSomaliaSouth AfricaSouth AsiaSouth Asia (IDA & IBRD)South SudanSpainSri LankaSt. Kitts and NevisSt. LuciaSt. Vincent and the GrenadinesSub-Saharan Africa Sub-Saharan Africa (excluding high income)Sub-Saharan Africa (IDA & IBRD countries)SudanSurinameSwazilandSwedenSwitzerlandSyrian Arab RepublicTajikistanTanzaniaThailandTimor-LesteTogoTongaTrinidad and TobagoTunisiaTurkeyTurkmenistanTuvaluUgandaUkraineUnited Arab EmiratesUnited KingdomUnited StatesUpper middle incomeUruguayUzbekistanVanuatuVenezuela, RBVietnamWest Bank and GazaWorldYemen, Rep.ZambiaZimbabwe línea de tiempo (timeline):
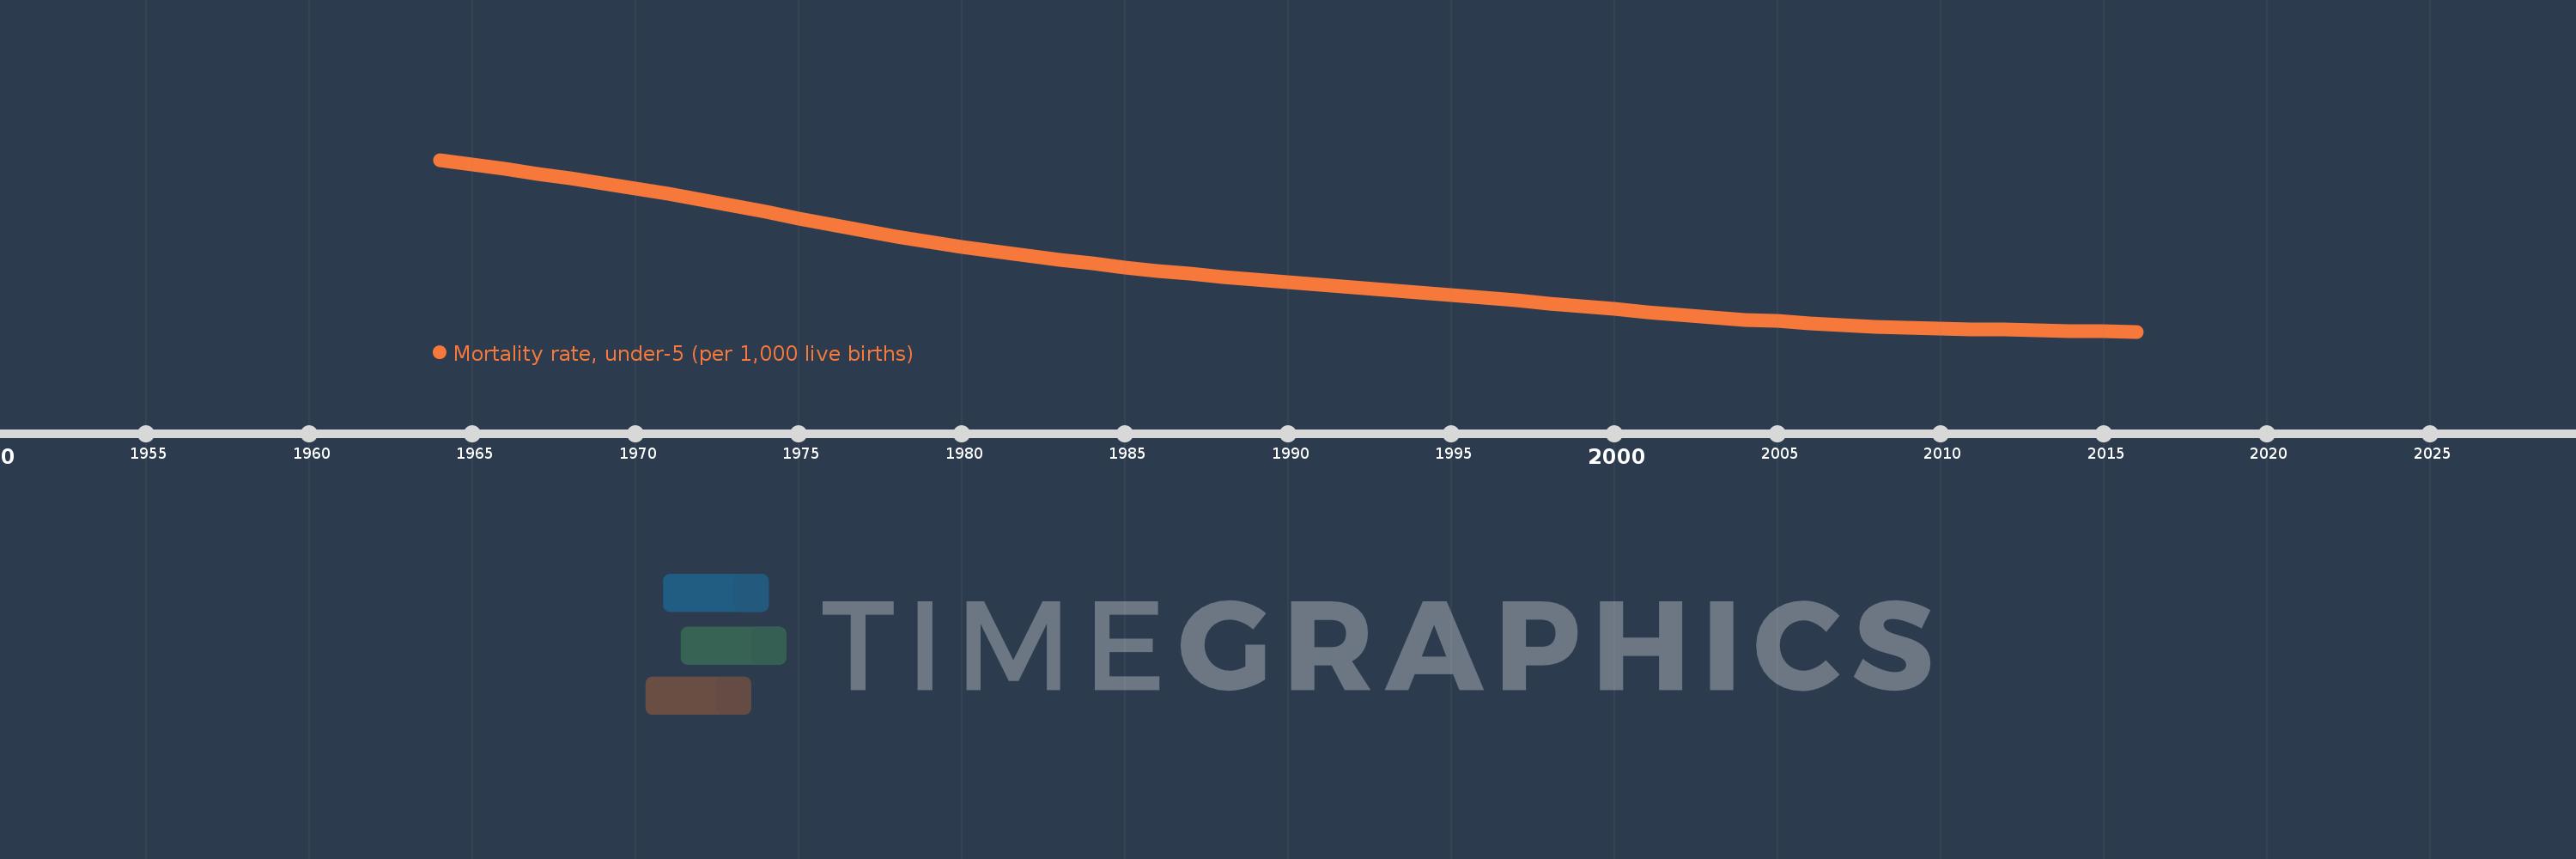
En esta escala de tiempo se presenta un gráfico de 1964 y 2016 de Maldives. Los datos de 1963 están ausentes. El número de observaciones reales por fecha: 53.
Fuente (nombre):
Indicadores del desarrollo mundial
Fuente (organización):
Estimates Developed by the UN Inter-agency Group for Child Mortality Estimation (UNICEF, WHO, World Bank, UN DESA Population Division) at www.childmortality.org. Projected data are from the United Nations Population Division's World Population Prospects; and may in some cases not be consistent with data before the current year.
Categorías:
Health, Aid Effectiveness, Climate Change
Se ha actualizado:
23 abr 2017 año
Los indicadores de los cambios de valor en los últimos años
Máximo:
323.5
1 ene 1964 año
A la fecha de observación
Valor
Cambio absoluto
El cambio con respecto al valor anterior
1 ene 1964 año
323.5
+323.5
0.0%
1 ene 1965 año
315.0
-8.5
-2.63%
1 ene 1966 año
306.6
-8.4
-2.67%
1 ene 1967 año
297.9
-8.7
-2.84%
1 ene 1968 año
289.0
-8.9
-2.99%
1 ene 1969 año
279.8
-9.2
-3.18%
1 ene 1970 año
270.5
-9.3
-3.32%
1 ene 1971 año
260.9
-9.6
-3.55%
1 ene 1972 año
250.5
-10.4
-3.99%
1 ene 1973 año
239.5
-11.0
-4.39%
1 ene 1974 año
227.9
-11.6
-4.84%
1 ene 1975 año
215.9
-12.0
-5.27%
1 ene 1976 año
204.4
-11.5
-5.33%
1 ene 1977 año
193.4
-11.0
-5.38%
1 ene 1978 año
183.0
-10.4
-5.38%
1 ene 1979 año
173.2
-9.8
-5.36%
1 ene 1980 año
163.9
-9.3
-5.37%
1 ene 1981 año
155.3
-8.6
-5.25%
1 ene 1982 año
147.3
-8.0
-5.15%
1 ene 1983 año
140.0
-7.3
-4.96%
1 ene 1984 año
133.1
-6.9
-4.93%
1 ene 1985 año
126.6
-6.5
-4.88%
1 ene 1986 año
120.3
-6.3
-4.98%
1 ene 1987 año
114.5
-5.8
-4.82%
1 ene 1988 año
108.9
-5.6
-4.89%
1 ene 1989 año
103.7
-5.2
-4.78%
1 ene 1990 año
98.8
-4.9
-4.73%
1 ene 1991 año
94.1
-4.7
-4.76%
1 ene 1992 año
89.5
-4.6
-4.89%
1 ene 1993 año
85.1
-4.4
-4.92%
1 ene 1994 año
80.4
-4.7
-5.52%
1 ene 1995 año
75.7
-4.7
-5.85%
1 ene 1996 año
70.8
-4.9
-6.47%
1 ene 1997 año
65.8
-5.0
-7.06%
1 ene 1998 año
60.5
-5.3
-8.05%
1 ene 1999 año
55.2
-5.3
-8.76%
1 ene 2000 año
49.8
-5.4
-9.78%
1 ene 2001 año
44.4
-5.4
-10.84%
1 ene 2002 año
39.2
-5.2
-11.71%
1 ene 2003 año
34.3
-4.9
-12.5%
1 ene 2004 año
29.9
-4.4
-12.83%
1 ene 2005 año
28.8
-1.1
-3.68%
1 ene 2006 año
22.8
-6.0
-20.83%
1 ene 2007 año
20.1
-2.7
-11.84%
1 ene 2008 año
17.8
-2.3
-11.44%
1 ene 2009 año
16.0
-1.8
-10.11%
1 ene 2010 año
14.4
-1.6
-10.0%
1 ene 2011 año
13.0
-1.4
-9.72%
1 ene 2012 año
11.8
-1.2
-9.23%
1 ene 2013 año
10.7
-1.1
-9.32%
1 ene 2014 año
9.9
-0.8
-7.48%
1 ene 2015 año
9.2
-0.7
-7.07%
1 ene 2016 año
8.6
-0.6
-6.52%
Ranking de los países por los datos estadísticos actuales


Comentarios: