29
/es/
es
AIzaSyAYiBZKx7MnpbEhh9jyipgxe19OcubqV5w
April 1, 2024
56399
Small states
SST
false
2
1
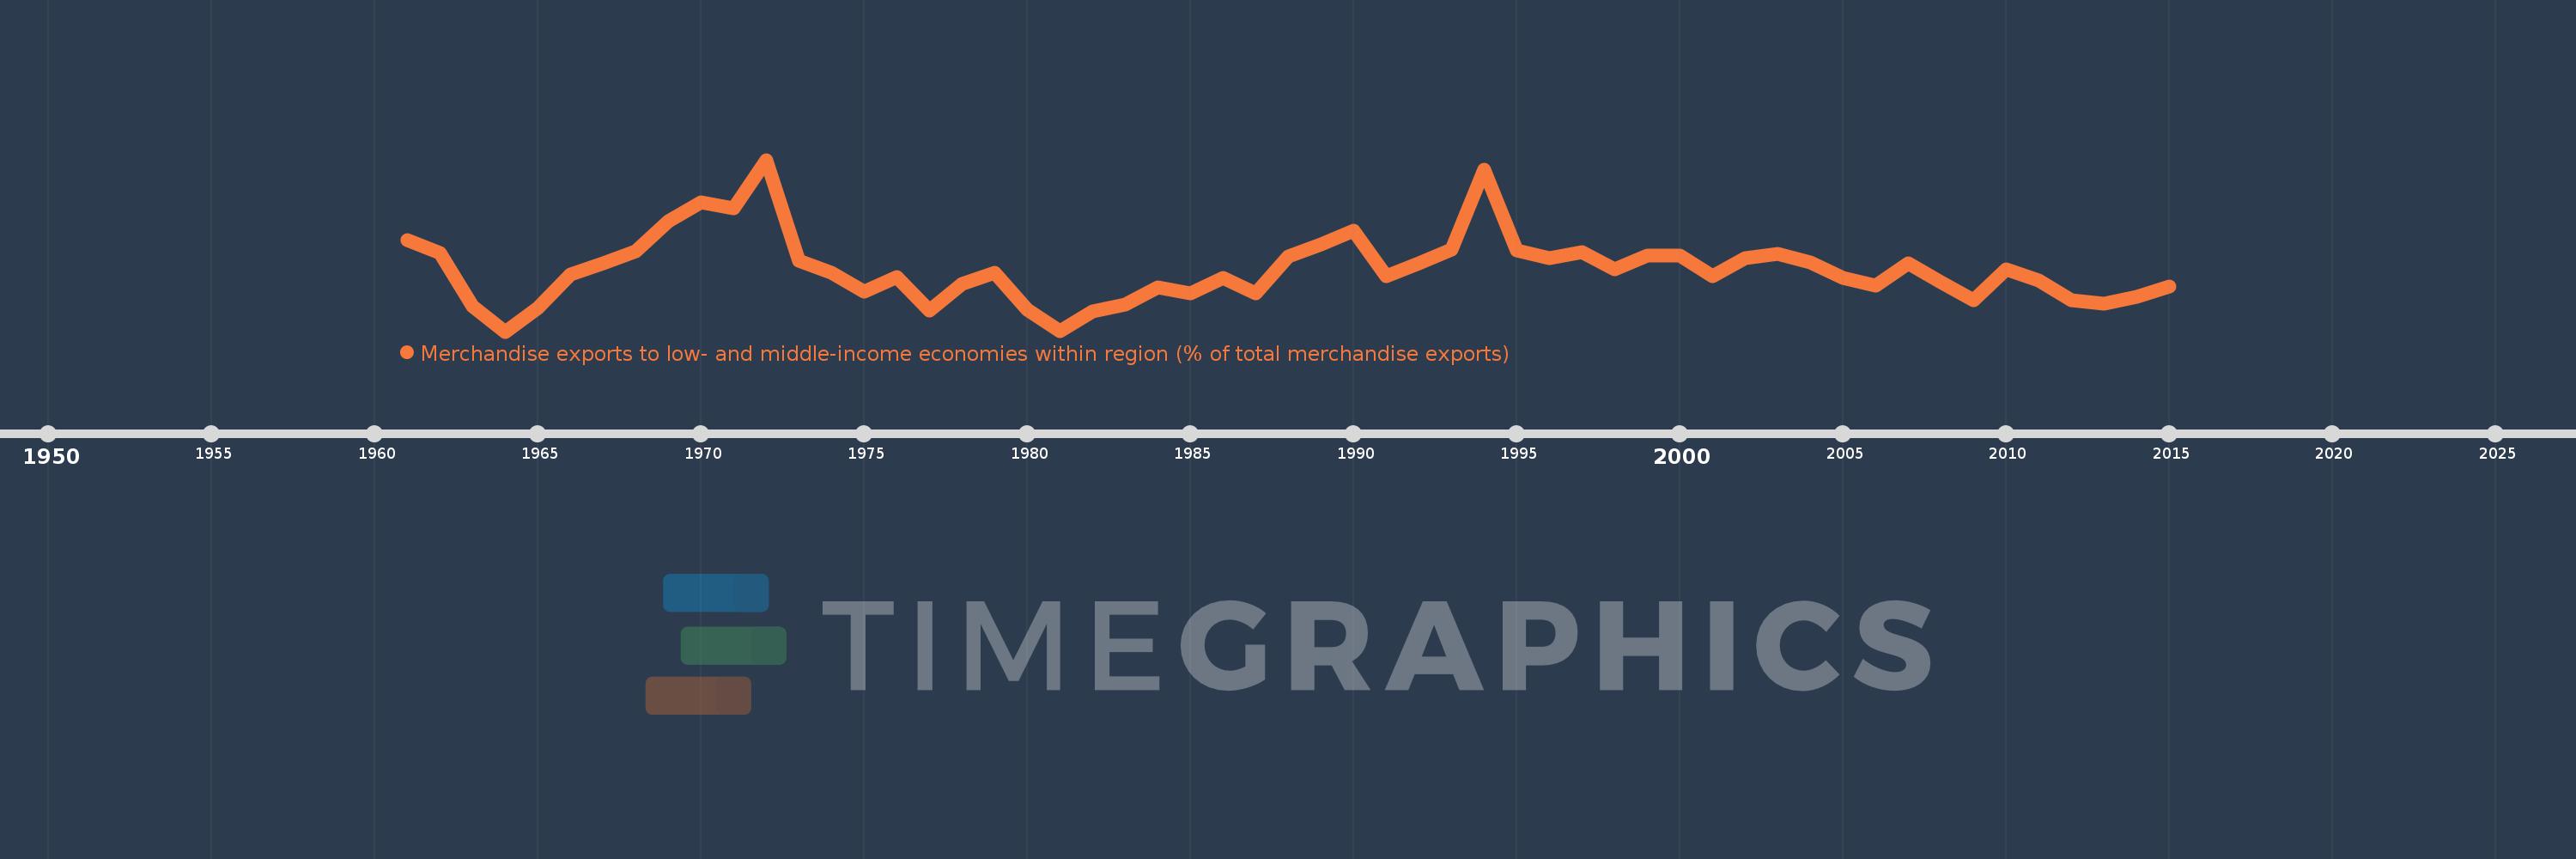
Merchandise exports to low- and middle-income economies within region (% of total merchandise exports)
2015,2014,2013,2012,2011,2010,2009,2008,2007,2006,2005,2004,2003,2002,2001,2000,1999,1998,1997,1996,1995,1994,1993,1992,1991,1990,1989,1988,1987,1986,1985,1984,1983,1982,1981,1980,1979,1978,1977,1976,1975,1974,1973,1972,1971,1970,1969,1968,1967,1966,1965,1964,1963,1962,1961
Estas estadísticas en otros países:
línea de tiempo (timeline):
En esta escala de tiempo se presenta un gráfico de 1961 y 2015 de Small states. Los datos de 1960 están ausentes. El número de observaciones reales por fecha: 55.
Fuente (nombre):
Indicadores del desarrollo mundial
Fuente (organización):
World Bank staff estimates based data from International Monetary Fund's Direction of Trade database.
Categorías:
Private Sector, Trade
Se ha actualizado:
23 abr 2017 año
Los indicadores de los cambios de valor en los últimos años
Mínimo:
0.548
1 ene 1964 año
Máximo:
1.966
1 ene 1972 año
A la fecha de observación
Valor
Cambio absoluto
El cambio con respecto al valor anterior
1 ene 1961 año
1.3
+1.3
0.0%
1 ene 1962 año
1.195
-0.105
-8.08%
1 ene 1963 año
0.754
-0.441
-36.89%
1 ene 1964 año
0.548
-0.207
-27.38%
1 ene 1965 año
0.744
+0.196
35.82%
1 ene 1966 año
1.018
+0.274
36.81%
1 ene 1967 año
1.114
+0.096
9.39%
1 ene 1968 año
1.214
+0.1
8.98%
1 ene 1969 año
1.456
+0.242
19.97%
1 ene 1970 año
1.618
+0.162
11.13%
1 ene 1971 año
1.565
-0.053
-3.29%
1 ene 1972 año
1.966
+0.401
25.65%
1 ene 1973 año
1.131
-0.835
-42.48%
1 ene 1974 año
1.037
-0.093
-8.26%
1 ene 1975 año
0.875
-0.163
-15.7%
1 ene 1976 año
0.998
+0.123
14.07%
1 ene 1977 año
0.724
-0.274
-27.48%
1 ene 1978 año
0.938
+0.214
29.58%
1 ene 1979 año
1.034
+0.096
10.25%
1 ene 1980 año
0.726
-0.308
-29.78%
1 ene 1981 año
0.551
-0.175
-24.16%
1 ene 1982 año
0.715
+0.164
29.8%
1 ene 1983 año
0.768
+0.054
7.51%
1 ene 1984 año
0.912
+0.143
18.66%
1 ene 1985 año
0.867
-0.045
-4.88%
1 ene 1986 año
0.994
+0.127
14.61%
1 ene 1987 año
0.867
-0.127
-12.76%
1 ene 1988 año
1.169
+0.303
34.89%
1 ene 1989 año
1.271
+0.101
8.65%
1 ene 1990 año
1.38
+0.11
8.65%
1 ene 1991 año
1.003
-0.377
-27.33%
1 ene 1992 año
1.112
+0.109
10.85%
1 ene 1993 año
1.227
+0.115
10.31%
1 ene 1994 año
1.888
+0.662
53.93%
1 ene 1995 año
1.215
-0.673
-35.63%
1 ene 1996 año
1.157
-0.058
-4.81%
1 ene 1997 año
1.203
+0.047
4.02%
1 ene 1998 año
1.059
-0.144
-11.99%
1 ene 1999 año
1.175
+0.116
10.91%
1 ene 2000 año
1.173
-0.001
-0.11%
1 ene 2001 año
1.004
-0.17
-14.47%
1 ene 2002 año
1.157
+0.153
15.27%
1 ene 2003 año
1.192
+0.035
2.99%
1 ene 2004 año
1.118
-0.074
-6.2%
1 ene 2005 año
0.992
-0.126
-11.24%
1 ene 2006 año
0.928
-0.064
-6.47%
1 ene 2007 año
1.111
+0.183
19.76%
1 ene 2008 año
0.955
-0.156
-14.08%
1 ene 2009 año
0.807
-0.148
-15.52%
1 ene 2010 año
1.061
+0.254
31.52%
1 ene 2011 año
0.968
-0.093
-8.79%
1 ene 2012 año
0.806
-0.162
-16.7%
1 ene 2013 año
0.775
-0.031
-3.81%
1 ene 2014 año
0.835
+0.059
7.66%
1 ene 2015 año
0.917
+0.083
9.9%
Ranking de los países por los datos estadísticos actuales


Comentarios: