29
/es/
es
AIzaSyAYiBZKx7MnpbEhh9jyipgxe19OcubqV5w
April 1, 2024
52813
OECD members
OED
false
2
1
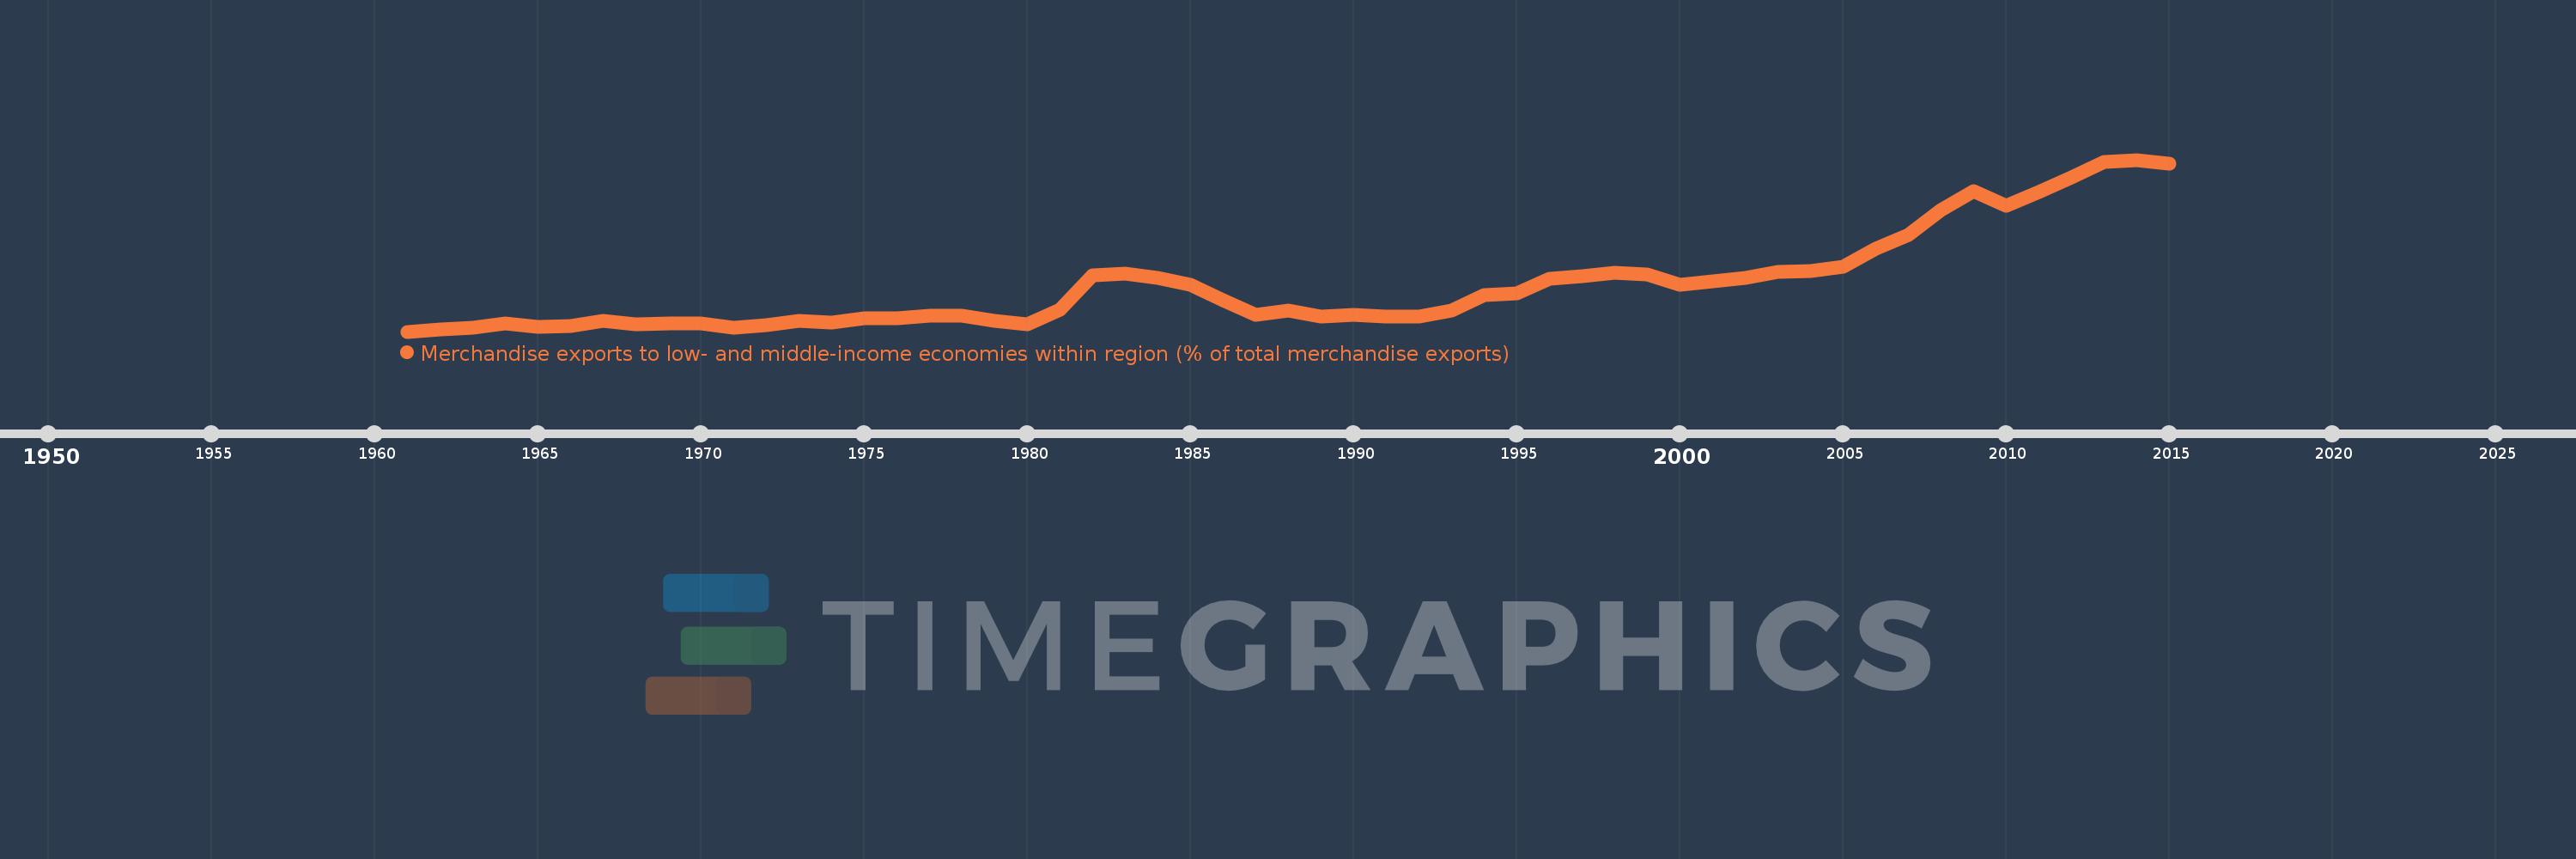
Merchandise exports to low- and middle-income economies within region (% of total merchandise exports)
2015,2014,2013,2012,2011,2010,2009,2008,2007,2006,2005,2004,2003,2002,2001,2000,1999,1998,1997,1996,1995,1994,1993,1992,1991,1990,1989,1988,1987,1986,1985,1984,1983,1982,1981,1980,1979,1978,1977,1976,1975,1974,1973,1972,1971,1970,1969,1968,1967,1966,1965,1964,1963,1962,1961
Estas estadísticas en otros países:
línea de tiempo (timeline):
En esta escala de tiempo se presenta un gráfico de 1961 y 2015 de OECD members. Los datos de 1960 están ausentes. El número de observaciones reales por fecha: 55.
Fuente (nombre):
Indicadores del desarrollo mundial
Fuente (organización):
World Bank staff estimates based data from International Monetary Fund's Direction of Trade database.
Categorías:
Private Sector, Trade
Se ha actualizado:
23 abr 2017 año
Los indicadores de los cambios de valor en los últimos años
Mínimo:
0.024
1 ene 1961 año
Máximo:
0.364
1 ene 2014 año
A la fecha de observación
Valor
Cambio absoluto
El cambio con respecto al valor anterior
1 ene 1961 año
0.024
+0.024
0.0%
1 ene 1962 año
0.028
+0.004
17.7%
1 ene 1963 año
0.032
+0.004
15.81%
1 ene 1964 año
0.04
+0.007
22.61%
1 ene 1965 año
0.033
-0.007
-16.41%
1 ene 1966 año
0.035
+0.002
4.6%
1 ene 1967 año
0.045
+0.011
30.67%
1 ene 1968 año
0.038
-0.007
-15.32%
1 ene 1969 año
0.041
+0.002
5.41%
1 ene 1970 año
0.04
0.0
-0.23%
1 ene 1971 año
0.031
-0.009
-22.78%
1 ene 1972 año
0.037
+0.005
17.15%
1 ene 1973 año
0.045
+0.009
23.86%
1 ene 1974 año
0.042
-0.003
-6.9%
1 ene 1975 año
0.051
+0.009
20.91%
1 ene 1976 año
0.051
0.0
-0.04%
1 ene 1977 año
0.055
+0.004
8.23%
1 ene 1978 año
0.055
0.0
-0.22%
1 ene 1979 año
0.046
-0.009
-15.68%
1 ene 1980 año
0.039
-0.007
-15.19%
1 ene 1981 año
0.067
+0.027
69.8%
1 ene 1982 año
0.136
+0.07
104.06%
1 ene 1983 año
0.138
+0.001
0.96%
1 ene 1984 año
0.13
-0.008
-5.57%
1 ene 1985 año
0.116
-0.014
-11.15%
1 ene 1986 año
0.086
-0.029
-25.33%
1 ene 1987 año
0.057
-0.029
-33.55%
1 ene 1988 año
0.066
+0.009
15.22%
1 ene 1989 año
0.053
-0.013
-19.25%
1 ene 1990 año
0.057
+0.004
6.75%
1 ene 1991 año
0.053
-0.004
-7.33%
1 ene 1992 año
0.054
+0.001
2.43%
1 ene 1993 año
0.066
+0.012
21.91%
1 ene 1994 año
0.096
+0.03
45.51%
1 ene 1995 año
0.1
+0.004
4.11%
1 ene 1996 año
0.128
+0.028
27.8%
1 ene 1997 año
0.134
+0.007
5.18%
1 ene 1998 año
0.14
+0.006
4.68%
1 ene 1999 año
0.137
-0.003
-2.06%
1 ene 2000 año
0.117
-0.021
-14.95%
1 ene 2001 año
0.124
+0.007
6.06%
1 ene 2002 año
0.131
+0.007
5.76%
1 ene 2003 año
0.142
+0.011
8.44%
1 ene 2004 año
0.144
+0.001
0.99%
1 ene 2005 año
0.153
+0.009
6.21%
1 ene 2006 año
0.188
+0.036
23.3%
1 ene 2007 año
0.216
+0.028
15.03%
1 ene 2008 año
0.265
+0.049
22.45%
1 ene 2009 año
0.302
+0.037
13.92%
1 ene 2010 año
0.273
-0.029
-9.72%
1 ene 2011 año
0.3
+0.027
10.06%
1 ene 2012 año
0.329
+0.029
9.65%
1 ene 2013 año
0.359
+0.03
9.01%
1 ene 2014 año
0.364
+0.005
1.45%
1 ene 2015 año
0.357
-0.006
-1.72%
Ranking de los países por los datos estadísticos actuales


Comentarios: