29
/es/
es
AIzaSyAYiBZKx7MnpbEhh9jyipgxe19OcubqV5w
April 1, 2024
143205
Grenada
GRD
true
2
1
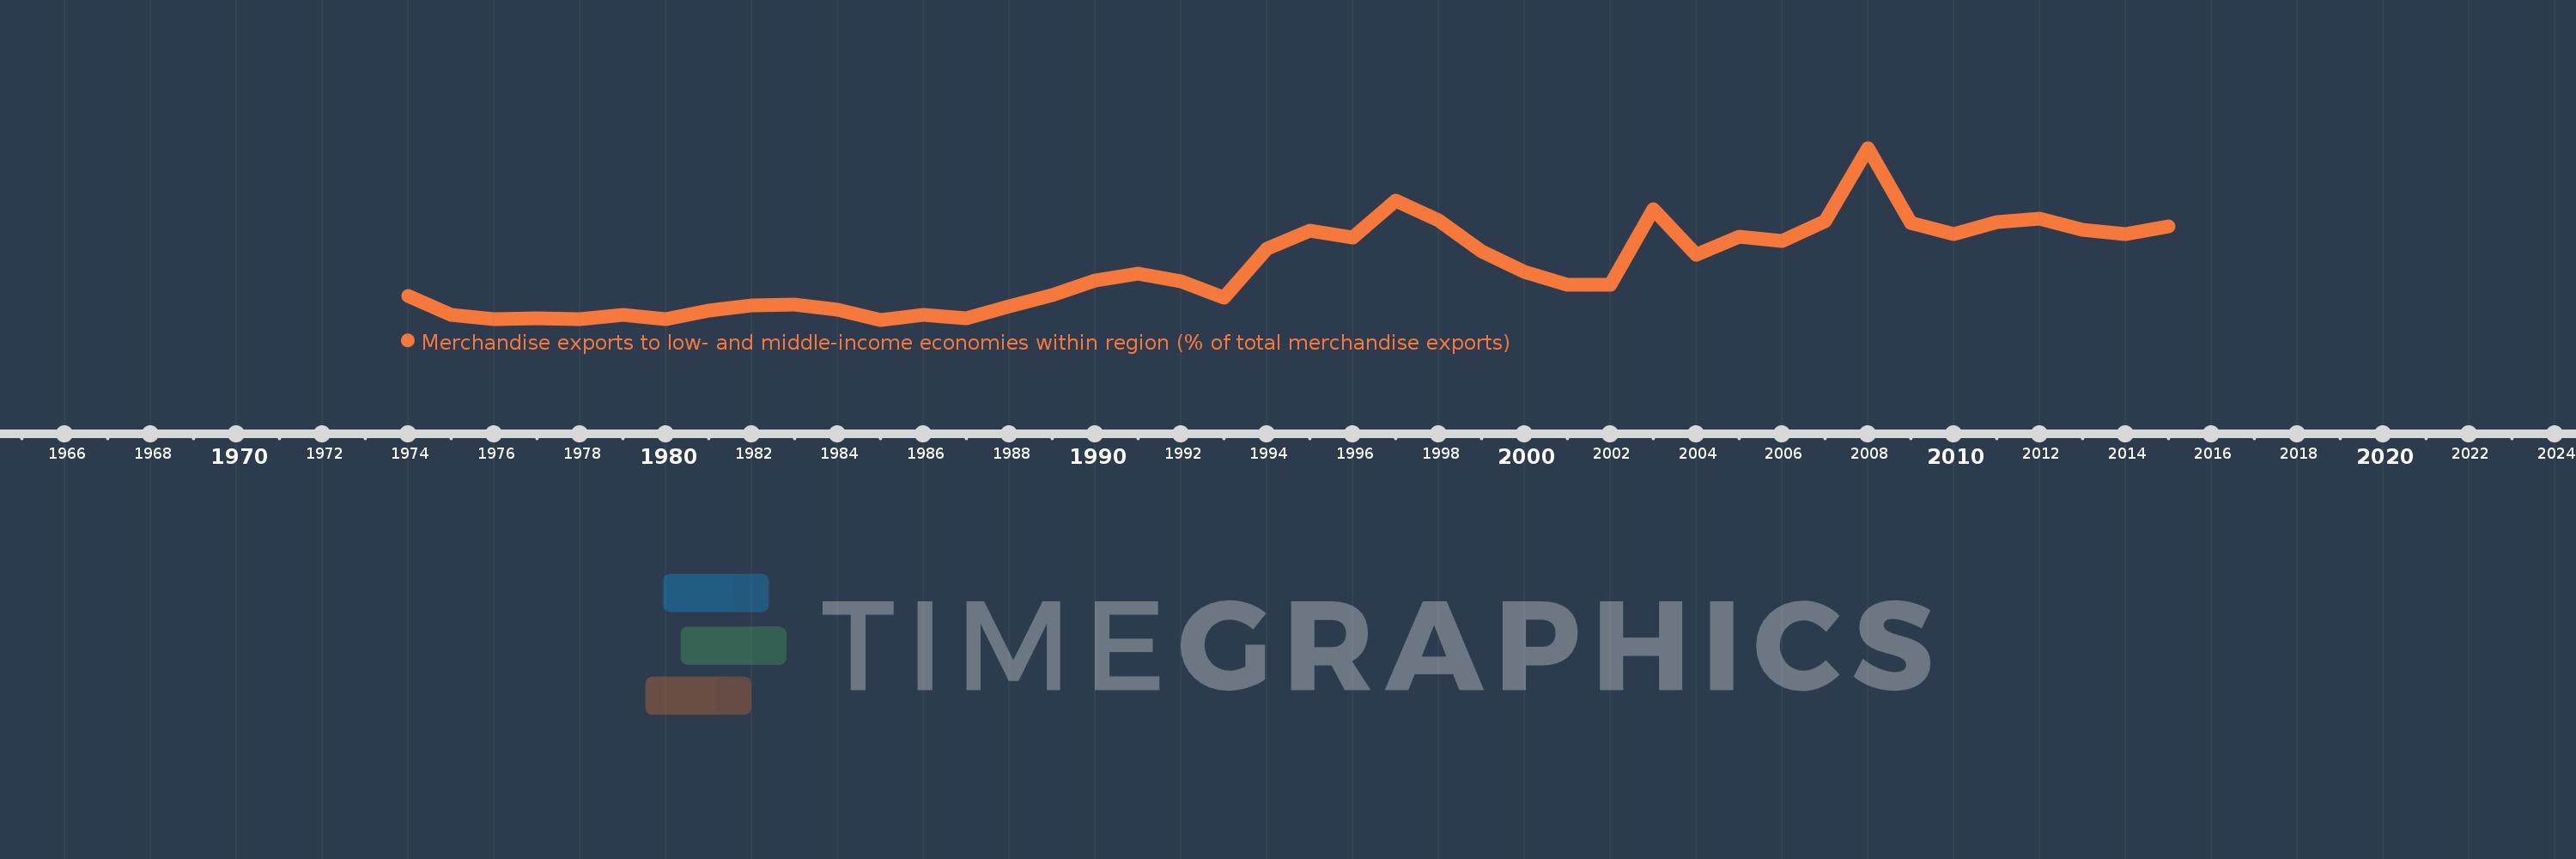
Merchandise exports to low- and middle-income economies within region (% of total merchandise exports)
2015,2014,2013,2012,2011,2010,2009,2008,2007,2006,2005,2004,2003,2002,2001,2000,1999,1998,1997,1996,1995,1994,1993,1992,1991,1990,1989,1988,1987,1986,1985,1984,1983,1982,1981,1980,1979,1978,1977,1976,1975,1974
Estas estadísticas en otros países:
línea de tiempo (timeline):
En esta escala de tiempo se presenta un gráfico de 1974 y 2015 de Grenada. Los datos de 1973 están ausentes. El número de observaciones reales por fecha: 42.
Fuente (nombre):
Indicadores del desarrollo mundial
Fuente (organización):
World Bank staff estimates based data from International Monetary Fund's Direction of Trade database.
Categorías:
Private Sector, Trade
Se ha actualizado:
23 abr 2017 año
Los indicadores de los cambios de valor en los últimos años
Mínimo:
0.429
1 ene 1985 año
Máximo:
36.163
1 ene 2008 año
A la fecha de observación
Valor
Cambio absoluto
El cambio con respecto al valor anterior
1 ene 1974 año
5.304
+5.304
0.0%
1 ene 1975 año
1.435
-3.87
-72.95%
1 ene 1976 año
0.496
-0.939
-65.46%
1 ene 1977 año
0.73
+0.234
47.23%
1 ene 1978 año
0.589
-0.141
-19.26%
1 ene 1979 año
1.519
+0.93
157.83%
1 ene 1980 año
0.548
-0.971
-63.91%
1 ene 1981 año
2.276
+1.728
315.21%
1 ene 1982 año
3.347
+1.071
47.05%
1 ene 1983 año
3.577
+0.231
6.89%
1 ene 1984 año
2.518
-1.059
-29.61%
1 ene 1985 año
0.429
-2.089
-82.97%
1 ene 1986 año
1.423
+0.995
231.92%
1 ene 1987 año
0.764
-0.659
-46.31%
1 ene 1988 año
3.158
+2.394
313.19%
1 ene 1989 año
5.631
+2.474
78.33%
1 ene 1990 año
8.517
+2.885
51.24%
1 ene 1991 año
10.078
+1.561
18.33%
1 ene 1992 año
8.5
-1.578
-15.66%
1 ene 1993 año
5.068
-3.432
-40.37%
1 ene 1994 año
15.122
+10.054
198.37%
1 ene 1995 año
18.895
+3.773
24.95%
1 ene 1996 año
17.571
-1.324
-7.01%
1 ene 1997 año
25.131
+7.56
43.02%
1 ene 1998 año
21.012
-4.119
-16.39%
1 ene 1999 año
14.631
-6.38
-30.36%
1 ene 2000 año
10.422
-4.209
-28.77%
1 ene 2001 año
7.692
-2.73
-26.19%
1 ene 2002 año
7.664
-0.028
-0.37%
1 ene 2003 año
23.511
+15.847
206.78%
1 ene 2004 año
13.992
-9.519
-40.49%
1 ene 2005 año
17.624
+3.632
25.95%
1 ene 2006 año
16.731
-0.893
-5.07%
1 ene 2007 año
20.982
+4.251
25.41%
1 ene 2008 año
36.163
+15.181
72.35%
1 ene 2009 año
20.634
-15.529
-42.94%
1 ene 2010 año
18.278
-2.356
-11.42%
1 ene 2011 año
20.813
+2.535
13.87%
1 ene 2012 año
21.401
+0.588
2.82%
1 ene 2013 año
19.133
-2.268
-10.6%
1 ene 2014 año
18.263
-0.869
-4.54%
1 ene 2015 año
19.868
+1.605
8.79%
Ranking de los países por los datos estadísticos actuales


Comentarios: