29
/es/
es
AIzaSyAYiBZKx7MnpbEhh9jyipgxe19OcubqV5w
April 1, 2024
54498
Pacific island small states
PSS
false
2
1
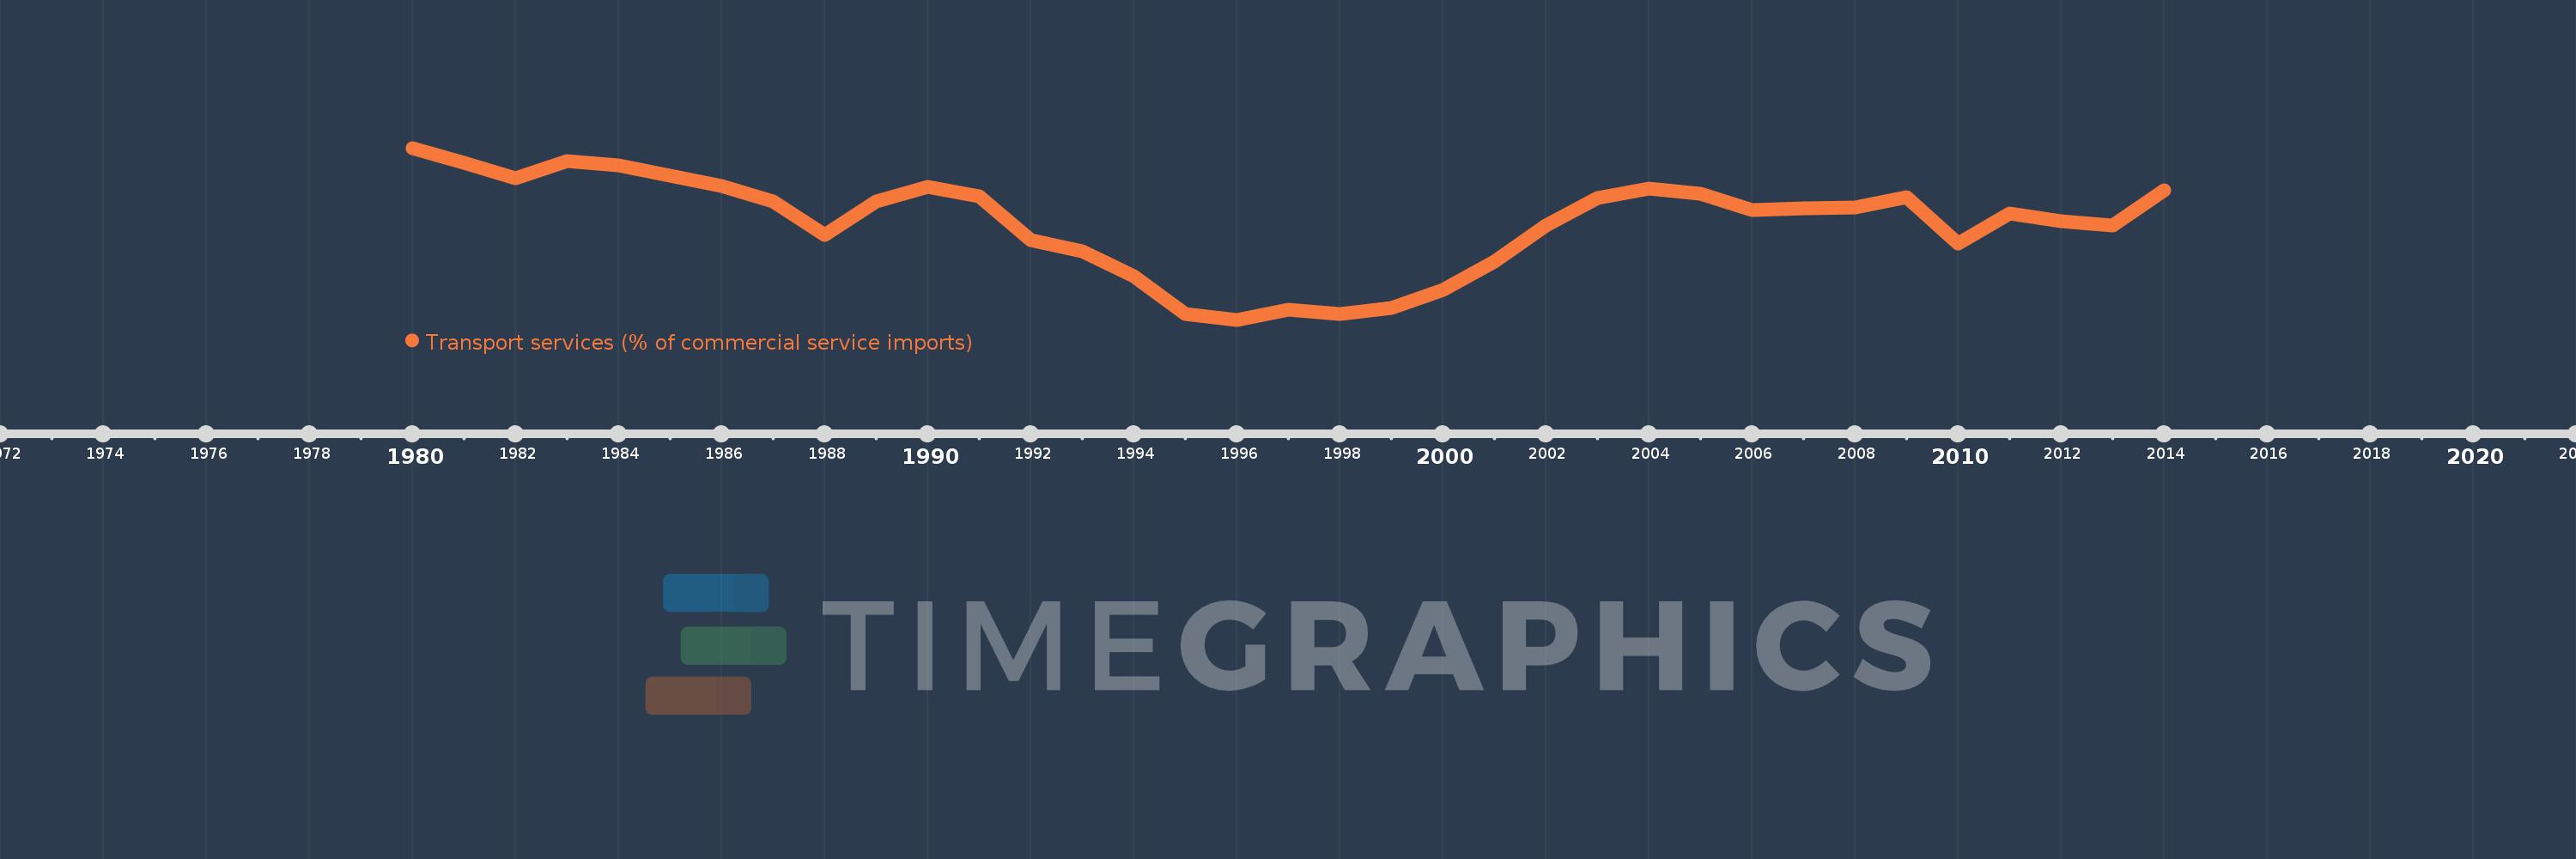
Transport services (% of commercial service imports)
2014,2013,2012,2011,2010,2009,2008,2007,2006,2005,2004,2003,2002,2001,2000,1999,1998,1997,1996,1995,1994,1993,1992,1991,1990,1989,1988,1987,1986,1985,1984,1983,1982,1981,1980
Estas estadísticas en otros países:
AfghanistanAlbaniaAlgeriaAngolaAntigua and BarbudaArab WorldArgentinaArmeniaArubaAustraliaAustriaAzerbaijanBahamas, TheBahrainBangladeshBarbadosBelarusBelgiumBelizeBeninBermudaBhutanBoliviaBosnia and HerzegovinaBotswanaBrazilBrunei DarussalamBulgariaBurkina FasoBurundiCabo VerdeCambodiaCameroonCanadaCaribbean small statesCentral African RepublicCentral Europe and the BalticsChadChileChinaColombiaComorosCongo, Dem. Rep.Congo, Rep.Costa RicaCote d'IvoireCroatiaCuracaoCyprusCzech RepublicDenmarkDjiboutiDominicaDominican RepublicEarly-demographic dividendEast Asia & PacificEast Asia & Pacific (excluding high income)East Asia & Pacific (IDA & IBRD countries)EcuadorEgypt, Arab Rep.El SalvadorEquatorial GuineaEritreaEstoniaEthiopiaEuro areaEurope & Central AsiaEurope & Central Asia (excluding high income)Europe & Central Asia (IDA & IBRD countries)European UnionFaroe IslandsFijiFinlandFragile and conflict affected situationsFranceFrench PolynesiaGabonGambia, TheGeorgiaGermanyGhanaGreeceGrenadaGuatemalaGuineaGuinea-BissauGuyanaHaitiHeavily indebted poor countries (HIPC)High incomeHondurasHong Kong SAR, ChinaHungaryIBRD onlyIcelandIDA & IBRD totalIDA onlyIDA totalIndiaIndonesiaIran, Islamic Rep.IraqIrelandIsraelItalyJamaicaJapanJordanKazakhstanKenyaKiribatiKorea, Rep.KosovoKuwaitKyrgyz RepublicLao PDRLate-demographic dividendLatin America & Caribbean Latin America & Caribbean (excluding high income)Latin America & the Caribbean (IDA & IBRD countries)LatviaLeast developed countries: UN classificationLebanonLesothoLiberiaLibyaLithuaniaLow & middle incomeLow incomeLower middle incomeLuxembourgMacao SAR, ChinaMacedonia, FYRMadagascarMalawiMalaysiaMaldivesMaliMaltaMarshall IslandsMauritaniaMauritiusMexicoMicronesia, Fed. Sts.Middle East & North AfricaMiddle East & North Africa (excluding high income)Middle East & North Africa (IDA & IBRD countries)Middle incomeMoldovaMongoliaMontenegroMoroccoMozambiqueMyanmarNamibiaNepalNetherlandsNew CaledoniaNew ZealandNicaraguaNigerNigeriaNorth AmericaNorwayOECD membersOmanOther small statesPacific island small statesPakistanPalauPanamaPapua New GuineaParaguayPeruPhilippinesPolandPortugalPost-demographic dividendPre-demographic dividendQatarRomaniaRussian FederationRwandaSamoaSao Tome and PrincipeSaudi ArabiaSenegalSerbiaSeychellesSierra LeoneSingaporeSint Maarten (Dutch part)Slovak RepublicSloveniaSmall statesSolomon IslandsSouth AfricaSouth AsiaSouth Asia (IDA & IBRD)South SudanSpainSri LankaSt. Kitts and NevisSt. LuciaSt. Vincent and the GrenadinesSub-Saharan Africa Sub-Saharan Africa (excluding high income)Sub-Saharan Africa (IDA & IBRD countries)SudanSurinameSwazilandSwedenSwitzerlandSyrian Arab RepublicTajikistanTanzaniaThailandTimor-LesteTogoTongaTrinidad and TobagoTunisiaTurkeyTuvaluUgandaUkraineUnited KingdomUnited StatesUpper middle incomeUruguayVanuatuVenezuela, RBWest Bank and GazaWorldYemen, Rep.ZambiaZimbabwe línea de tiempo (timeline):
En esta escala de tiempo se presenta un gráfico de 1980 y 2014 de Pacific island small states. Los datos de 1979 están ausentes. El número de observaciones reales por fecha: 35.
Fuente (nombre):
Indicadores del desarrollo mundial
Fuente (organización):
International Monetary Fund, Balance of Payments Statistics Yearbook and data files.
Categorías:
Private Sector, Trade
Se ha actualizado:
23 abr 2017 año
Los indicadores de los cambios de valor en los últimos años
Mínimo:
38.674
1 ene 1996 año
Máximo:
62.054
1 ene 1980 año
A la fecha de observación
Valor
Cambio absoluto
El cambio con respecto al valor anterior
1 ene 1980 año
62.054
+62.054
0.0%
1 ene 1981 año
60.029
-2.026
-3.26%
1 ene 1982 año
57.922
-2.107
-3.51%
1 ene 1983 año
60.237
+2.315
4.0%
1 ene 1984 año
59.656
-0.581
-0.96%
1 ene 1985 año
58.227
-1.43
-2.4%
1 ene 1986 año
56.886
-1.34
-2.3%
1 ene 1987 año
54.812
-2.075
-3.65%
1 ene 1988 año
50.266
-4.546
-8.29%
1 ene 1989 año
54.762
+4.496
8.94%
1 ene 1990 año
56.705
+1.943
3.55%
1 ene 1991 año
55.483
-1.221
-2.15%
1 ene 1992 año
49.569
-5.914
-10.66%
1 ene 1993 año
47.94
-1.628
-3.29%
1 ene 1994 año
44.631
-3.309
-6.9%
1 ene 1995 año
39.403
-5.228
-11.71%
1 ene 1996 año
38.674
-0.73
-1.85%
1 ene 1997 año
40.061
+1.387
3.59%
1 ene 1998 año
39.455
-0.606
-1.51%
1 ene 1999 año
40.281
+0.826
2.09%
1 ene 2000 año
42.698
+2.417
6.0%
1 ene 2001 año
46.568
+3.87
9.06%
1 ene 2002 año
51.449
+4.881
10.48%
1 ene 2003 año
55.185
+3.737
7.26%
1 ene 2004 año
56.577
+1.392
2.52%
1 ene 2005 año
55.811
-0.766
-1.35%
1 ene 2006 año
53.607
-2.204
-3.95%
1 ene 2007 año
53.789
+0.182
0.34%
1 ene 2008 año
53.977
+0.188
0.35%
1 ene 2009 año
55.378
+1.401
2.6%
1 ene 2010 año
49.079
-6.299
-11.37%
1 ene 2011 año
53.117
+4.038
8.23%
1 ene 2012 año
52.079
-1.038
-1.95%
1 ene 2013 año
51.5
-0.579
-1.11%
1 ene 2014 año
56.286
+4.787
9.29%
Ranking de los países por los datos estadísticos actuales


Comentarios: