29
/es/
es
AIzaSyAYiBZKx7MnpbEhh9jyipgxe19OcubqV5w
April 1, 2024
163384
Jamaica
JAM
true
2
1
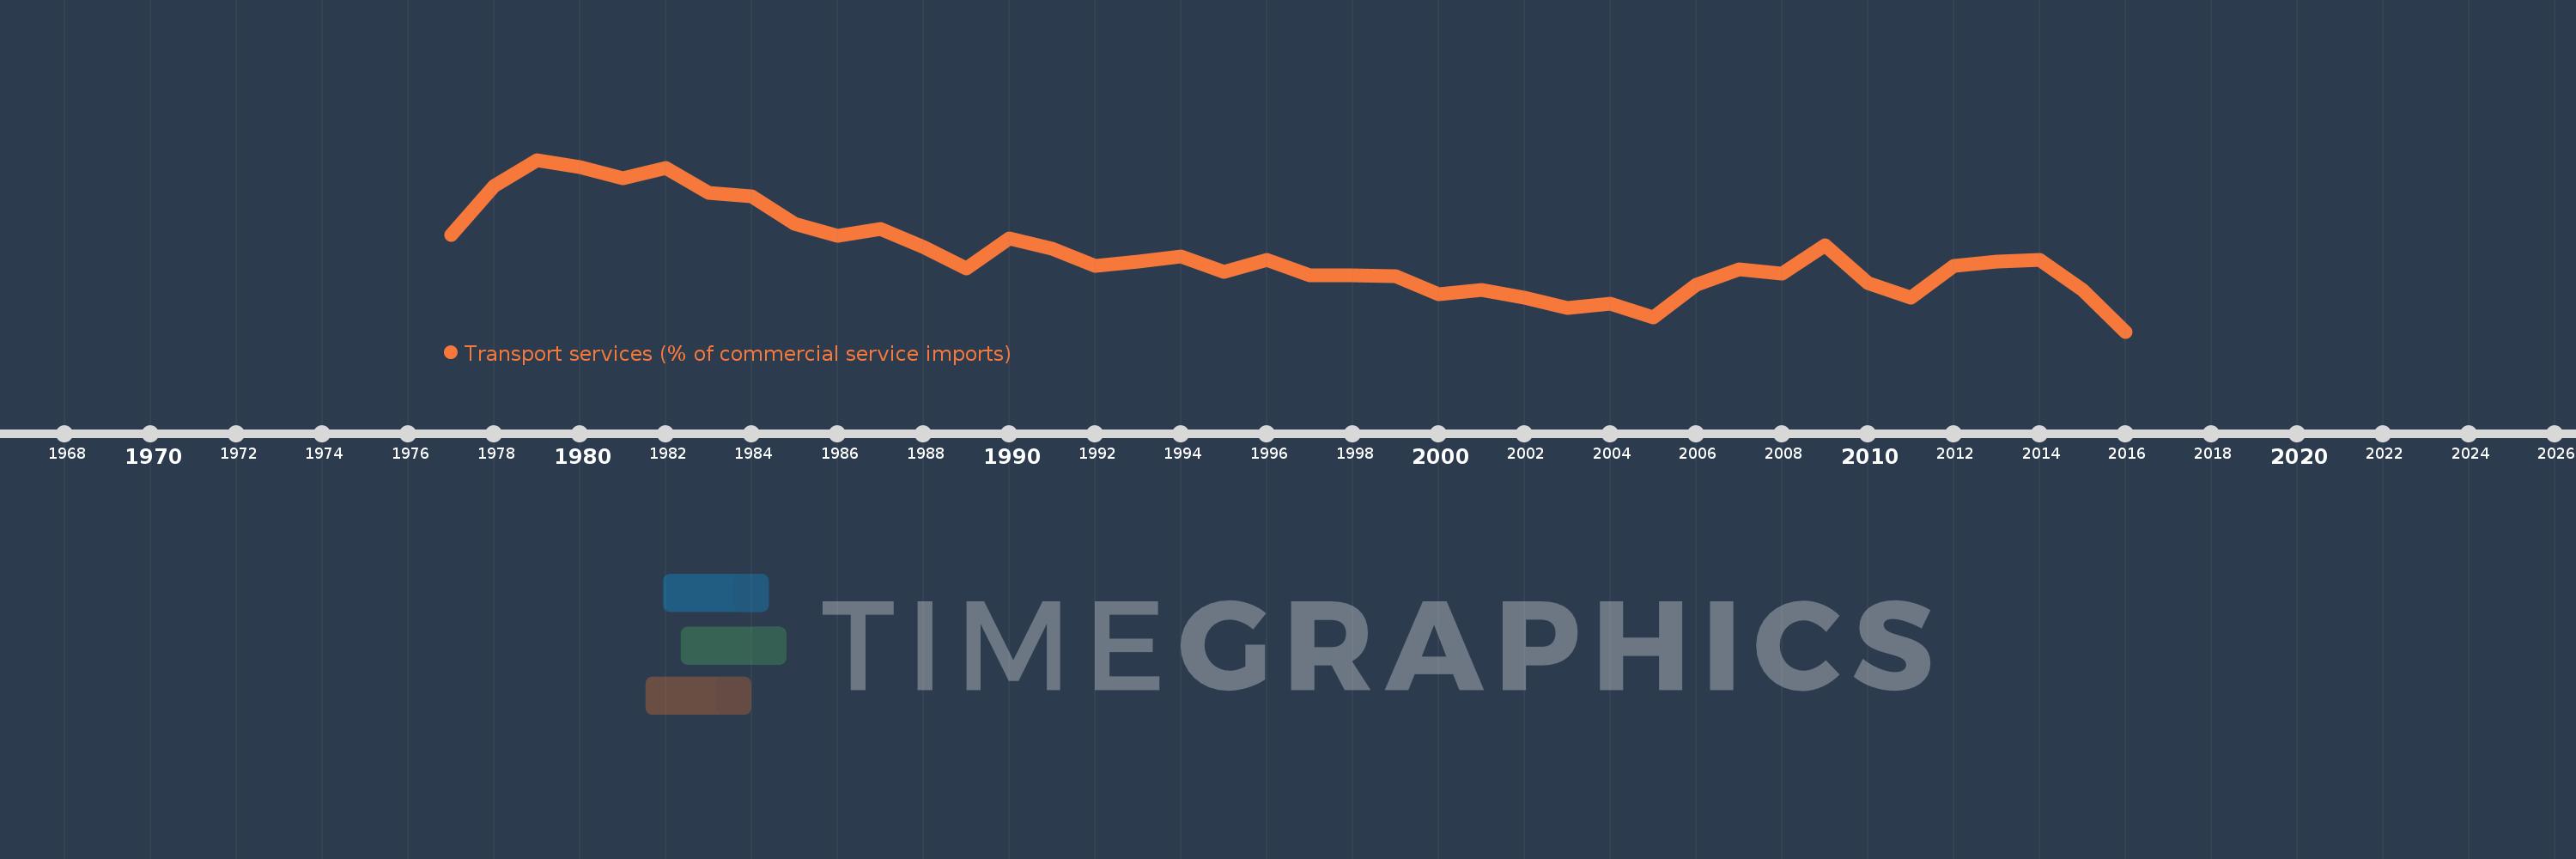
Transport services (% of commercial service imports)
2016,2015,2014,2013,2012,2011,2010,2009,2008,2007,2006,2005,2004,2003,2002,2001,2000,1999,1998,1997,1996,1995,1994,1993,1992,1991,1990,1989,1988,1987,1986,1985,1984,1983,1982,1981,1980,1979,1978,1977
Estas estadísticas en otros países:
AfghanistanAlbaniaAlgeriaAngolaAntigua and BarbudaArab WorldArgentinaArmeniaArubaAustraliaAustriaAzerbaijanBahamas, TheBahrainBangladeshBarbadosBelarusBelgiumBelizeBeninBermudaBhutanBoliviaBosnia and HerzegovinaBotswanaBrazilBrunei DarussalamBulgariaBurkina FasoBurundiCabo VerdeCambodiaCameroonCanadaCaribbean small statesCentral African RepublicCentral Europe and the BalticsChadChileChinaColombiaComorosCongo, Dem. Rep.Congo, Rep.Costa RicaCote d'IvoireCroatiaCuracaoCyprusCzech RepublicDenmarkDjiboutiDominicaDominican RepublicEarly-demographic dividendEast Asia & PacificEast Asia & Pacific (excluding high income)East Asia & Pacific (IDA & IBRD countries)EcuadorEgypt, Arab Rep.El SalvadorEquatorial GuineaEritreaEstoniaEthiopiaEuro areaEurope & Central AsiaEurope & Central Asia (excluding high income)Europe & Central Asia (IDA & IBRD countries)European UnionFaroe IslandsFijiFinlandFragile and conflict affected situationsFranceFrench PolynesiaGabonGambia, TheGeorgiaGermanyGhanaGreeceGrenadaGuatemalaGuineaGuinea-BissauGuyanaHaitiHeavily indebted poor countries (HIPC)High incomeHondurasHong Kong SAR, ChinaHungaryIBRD onlyIcelandIDA & IBRD totalIDA onlyIDA totalIndiaIndonesiaIran, Islamic Rep.IraqIrelandIsraelItalyJamaicaJapanJordanKazakhstanKenyaKiribatiKorea, Rep.KosovoKuwaitKyrgyz RepublicLao PDRLate-demographic dividendLatin America & Caribbean Latin America & Caribbean (excluding high income)Latin America & the Caribbean (IDA & IBRD countries)LatviaLeast developed countries: UN classificationLebanonLesothoLiberiaLibyaLithuaniaLow & middle incomeLow incomeLower middle incomeLuxembourgMacao SAR, ChinaMacedonia, FYRMadagascarMalawiMalaysiaMaldivesMaliMaltaMarshall IslandsMauritaniaMauritiusMexicoMicronesia, Fed. Sts.Middle East & North AfricaMiddle East & North Africa (excluding high income)Middle East & North Africa (IDA & IBRD countries)Middle incomeMoldovaMongoliaMontenegroMoroccoMozambiqueMyanmarNamibiaNepalNetherlandsNew CaledoniaNew ZealandNicaraguaNigerNigeriaNorth AmericaNorwayOECD membersOmanOther small statesPacific island small statesPakistanPalauPanamaPapua New GuineaParaguayPeruPhilippinesPolandPortugalPost-demographic dividendPre-demographic dividendQatarRomaniaRussian FederationRwandaSamoaSao Tome and PrincipeSaudi ArabiaSenegalSerbiaSeychellesSierra LeoneSingaporeSint Maarten (Dutch part)Slovak RepublicSloveniaSmall statesSolomon IslandsSouth AfricaSouth AsiaSouth Asia (IDA & IBRD)South SudanSpainSri LankaSt. Kitts and NevisSt. LuciaSt. Vincent and the GrenadinesSub-Saharan Africa Sub-Saharan Africa (excluding high income)Sub-Saharan Africa (IDA & IBRD countries)SudanSurinameSwazilandSwedenSwitzerlandSyrian Arab RepublicTajikistanTanzaniaThailandTimor-LesteTogoTongaTrinidad and TobagoTunisiaTurkeyTuvaluUgandaUkraineUnited KingdomUnited StatesUpper middle incomeUruguayVanuatuVenezuela, RBWest Bank and GazaWorldYemen, Rep.ZambiaZimbabwe línea de tiempo (timeline):
En esta escala de tiempo se presenta un gráfico de 1977 y 2016 de Jamaica. Los datos de 1976 están ausentes. El número de observaciones reales por fecha: 40.
Fuente (nombre):
Indicadores del desarrollo mundial
Fuente (organización):
International Monetary Fund, Balance of Payments Statistics Yearbook and data files.
Categorías:
Private Sector, Trade
Se ha actualizado:
23 abr 2017 año
Los indicadores de los cambios de valor en los últimos años
Mínimo:
36.372
1 ene 2016 año
Máximo:
60.083
1 ene 1979 año
A la fecha de observación
Valor
Cambio absoluto
El cambio con respecto al valor anterior
1 ene 1977 año
49.739
+49.739
0.0%
1 ene 1978 año
56.434
+6.696
13.46%
1 ene 1979 año
60.083
+3.649
6.47%
1 ene 1980 año
59.038
-1.045
-1.74%
1 ene 1981 año
57.52
-1.518
-2.57%
1 ene 1982 año
58.972
+1.452
2.52%
1 ene 1983 año
55.505
-3.467
-5.88%
1 ene 1984 año
55.0
-0.505
-0.91%
1 ene 1985 año
51.268
-3.732
-6.78%
1 ene 1986 año
49.628
-1.64
-3.2%
1 ene 1987 año
50.509
+0.881
1.78%
1 ene 1988 año
48.052
-2.457
-4.86%
1 ene 1989 año
45.066
-2.986
-6.21%
1 ene 1990 año
49.246
+4.18
9.27%
1 ene 1991 año
47.87
-1.376
-2.79%
1 ene 1992 año
45.492
-2.379
-4.97%
1 ene 1993 año
46.033
+0.541
1.19%
1 ene 1994 año
46.715
+0.682
1.48%
1 ene 1995 año
44.652
-2.063
-4.42%
1 ene 1996 año
46.296
+1.645
3.68%
1 ene 1997 año
44.137
-2.159
-4.66%
1 ene 1998 año
44.102
-0.036
-0.08%
1 ene 1999 año
44.063
-0.039
-0.09%
1 ene 2000 año
41.503
-2.56
-5.81%
1 ene 2001 año
42.086
+0.582
1.4%
1 ene 2002 año
40.996
-1.09
-2.59%
1 ene 2003 año
39.589
-1.407
-3.43%
1 ene 2004 año
40.185
+0.596
1.5%
1 ene 2005 año
38.373
-1.811
-4.51%
1 ene 2006 año
42.833
+4.46
11.62%
1 ene 2007 año
44.956
+2.123
4.96%
1 ene 2008 año
44.373
-0.583
-1.3%
1 ene 2009 año
48.328
+3.955
8.91%
1 ene 2010 año
43.057
-5.271
-10.91%
1 ene 2011 año
41.053
-2.004
-4.65%
1 ene 2012 año
45.431
+4.378
10.66%
1 ene 2013 año
45.99
+0.559
1.23%
1 ene 2014 año
46.3
+0.31
0.67%
1 ene 2015 año
42.124
-4.176
-9.02%
1 ene 2016 año
36.372
-5.752
-13.65%
Ranking de los países por los datos estadísticos actuales


Comentarios: