29
/es/
es
AIzaSyAYiBZKx7MnpbEhh9jyipgxe19OcubqV5w
April 1, 2024
207555
Nepal
NPL
true
2
1
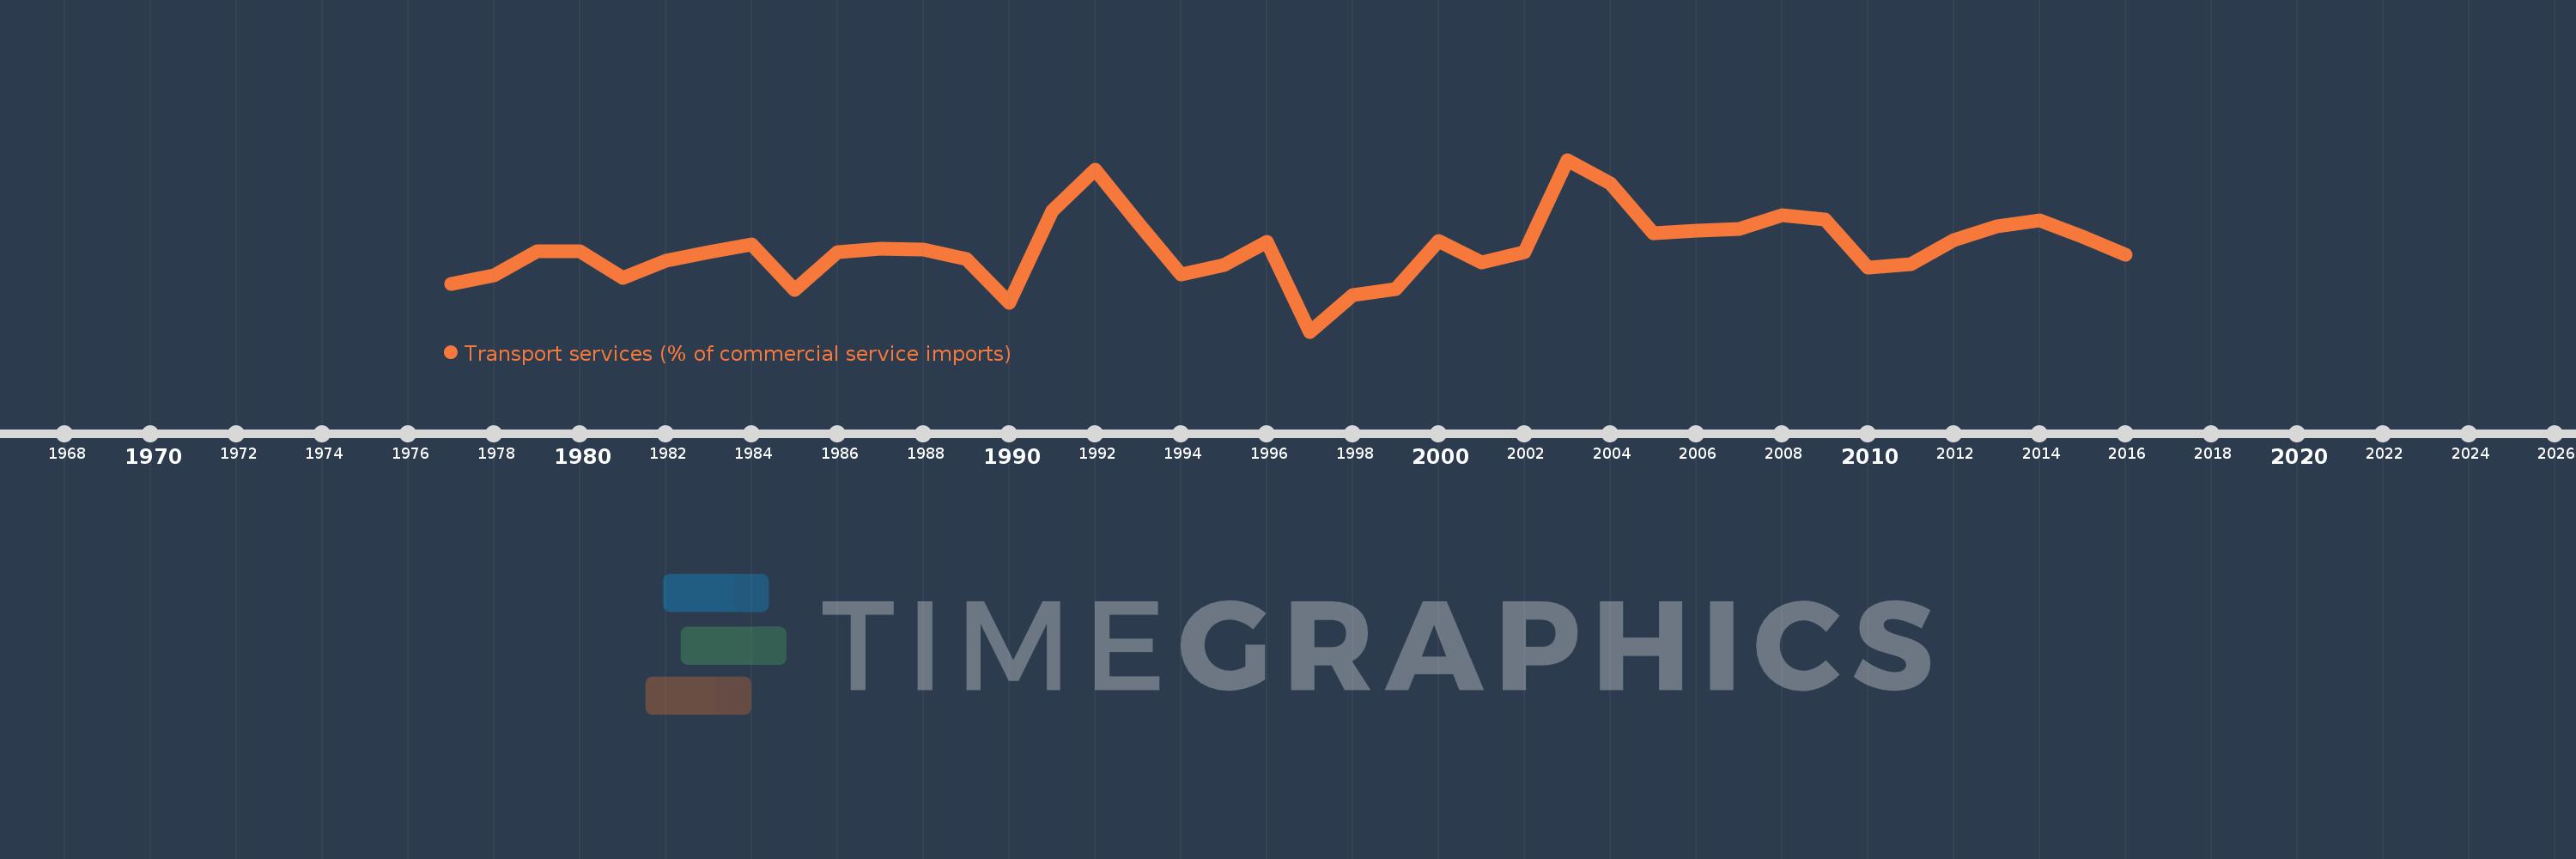
Transport services (% of commercial service imports)
2016,2015,2014,2013,2012,2011,2010,2009,2008,2007,2006,2005,2004,2003,2002,2001,2000,1999,1998,1997,1996,1995,1994,1993,1992,1991,1990,1989,1988,1987,1986,1985,1984,1983,1982,1981,1980,1979,1978,1977
Estas estadísticas en otros países:
AfghanistanAlbaniaAlgeriaAngolaAntigua and BarbudaArab WorldArgentinaArmeniaArubaAustraliaAustriaAzerbaijanBahamas, TheBahrainBangladeshBarbadosBelarusBelgiumBelizeBeninBermudaBhutanBoliviaBosnia and HerzegovinaBotswanaBrazilBrunei DarussalamBulgariaBurkina FasoBurundiCabo VerdeCambodiaCameroonCanadaCaribbean small statesCentral African RepublicCentral Europe and the BalticsChadChileChinaColombiaComorosCongo, Dem. Rep.Congo, Rep.Costa RicaCote d'IvoireCroatiaCuracaoCyprusCzech RepublicDenmarkDjiboutiDominicaDominican RepublicEarly-demographic dividendEast Asia & PacificEast Asia & Pacific (excluding high income)East Asia & Pacific (IDA & IBRD countries)EcuadorEgypt, Arab Rep.El SalvadorEquatorial GuineaEritreaEstoniaEthiopiaEuro areaEurope & Central AsiaEurope & Central Asia (excluding high income)Europe & Central Asia (IDA & IBRD countries)European UnionFaroe IslandsFijiFinlandFragile and conflict affected situationsFranceFrench PolynesiaGabonGambia, TheGeorgiaGermanyGhanaGreeceGrenadaGuatemalaGuineaGuinea-BissauGuyanaHaitiHeavily indebted poor countries (HIPC)High incomeHondurasHong Kong SAR, ChinaHungaryIBRD onlyIcelandIDA & IBRD totalIDA onlyIDA totalIndiaIndonesiaIran, Islamic Rep.IraqIrelandIsraelItalyJamaicaJapanJordanKazakhstanKenyaKiribatiKorea, Rep.KosovoKuwaitKyrgyz RepublicLao PDRLate-demographic dividendLatin America & Caribbean Latin America & Caribbean (excluding high income)Latin America & the Caribbean (IDA & IBRD countries)LatviaLeast developed countries: UN classificationLebanonLesothoLiberiaLibyaLithuaniaLow & middle incomeLow incomeLower middle incomeLuxembourgMacao SAR, ChinaMacedonia, FYRMadagascarMalawiMalaysiaMaldivesMaliMaltaMarshall IslandsMauritaniaMauritiusMexicoMicronesia, Fed. Sts.Middle East & North AfricaMiddle East & North Africa (excluding high income)Middle East & North Africa (IDA & IBRD countries)Middle incomeMoldovaMongoliaMontenegroMoroccoMozambiqueMyanmarNamibiaNepalNetherlandsNew CaledoniaNew ZealandNicaraguaNigerNigeriaNorth AmericaNorwayOECD membersOmanOther small statesPacific island small statesPakistanPalauPanamaPapua New GuineaParaguayPeruPhilippinesPolandPortugalPost-demographic dividendPre-demographic dividendQatarRomaniaRussian FederationRwandaSamoaSao Tome and PrincipeSaudi ArabiaSenegalSerbiaSeychellesSierra LeoneSingaporeSint Maarten (Dutch part)Slovak RepublicSloveniaSmall statesSolomon IslandsSouth AfricaSouth AsiaSouth Asia (IDA & IBRD)South SudanSpainSri LankaSt. Kitts and NevisSt. LuciaSt. Vincent and the GrenadinesSub-Saharan Africa Sub-Saharan Africa (excluding high income)Sub-Saharan Africa (IDA & IBRD countries)SudanSurinameSwazilandSwedenSwitzerlandSyrian Arab RepublicTajikistanTanzaniaThailandTimor-LesteTogoTongaTrinidad and TobagoTunisiaTurkeyTuvaluUgandaUkraineUnited KingdomUnited StatesUpper middle incomeUruguayVanuatuVenezuela, RBWest Bank and GazaWorldYemen, Rep.ZambiaZimbabwe línea de tiempo (timeline):
En esta escala de tiempo se presenta un gráfico de 1977 y 2016 de Nepal. Los datos de 1976 están ausentes. El número de observaciones reales por fecha: 40.
Fuente (nombre):
Indicadores del desarrollo mundial
Fuente (organización):
International Monetary Fund, Balance of Payments Statistics Yearbook and data files.
Categorías:
Private Sector, Trade
Se ha actualizado:
23 abr 2017 año
Los indicadores de los cambios de valor en los últimos años
Mínimo:
23.675
1 ene 1997 año
Máximo:
47.977
1 ene 2003 año
A la fecha de observación
Valor
Cambio absoluto
El cambio con respecto al valor anterior
1 ene 1977 año
30.408
+30.408
0.0%
1 ene 1978 año
31.629
+1.22
4.01%
1 ene 1979 año
34.995
+3.366
10.64%
1 ene 1980 año
35.089
+0.094
0.27%
1 ene 1981 año
31.244
-3.845
-10.96%
1 ene 1982 año
33.696
+2.452
7.85%
1 ene 1983 año
34.917
+1.221
3.62%
1 ene 1984 año
36.015
+1.098
3.15%
1 ene 1985 año
29.532
-6.483
-18.0%
1 ene 1986 año
34.96
+5.429
18.38%
1 ene 1987 año
35.364
+0.403
1.15%
1 ene 1988 año
35.338
-0.026
-0.07%
1 ene 1989 año
33.949
-1.389
-3.93%
1 ene 1990 año
27.78
-6.169
-18.17%
1 ene 1991 año
40.802
+13.022
46.88%
1 ene 1992 año
46.635
+5.833
14.3%
1 ene 1993 año
39.065
-7.569
-16.23%
1 ene 1994 año
31.799
-7.267
-18.6%
1 ene 1995 año
33.122
+1.323
4.16%
1 ene 1996 año
36.324
+3.203
9.67%
1 ene 1997 año
23.675
-12.649
-34.82%
1 ene 1998 año
28.836
+5.161
21.8%
1 ene 1999 año
29.678
+0.843
2.92%
1 ene 2000 año
36.482
+6.804
22.93%
1 ene 2001 año
33.514
-2.968
-8.13%
1 ene 2002 año
34.888
+1.373
4.1%
1 ene 2003 año
47.977
+13.089
37.52%
1 ene 2004 año
44.639
-3.337
-6.96%
1 ene 2005 año
37.647
-6.992
-15.66%
1 ene 2006 año
37.95
+0.303
0.8%
1 ene 2007 año
38.165
+0.215
0.57%
1 ene 2008 año
40.122
+1.958
5.13%
1 ene 2009 año
39.507
-0.616
-1.53%
1 ene 2010 año
32.78
-6.727
-17.03%
1 ene 2011 año
33.232
+0.452
1.38%
1 ene 2012 año
36.632
+3.4
10.23%
1 ene 2013 año
38.617
+1.985
5.42%
1 ene 2014 año
39.414
+0.797
2.06%
1 ene 2015 año
37.085
-2.328
-5.91%
1 ene 2016 año
34.585
-2.501
-6.74%
Ranking de los países por los datos estadísticos actuales


Comentarios: