29
/es/
es
AIzaSyAYiBZKx7MnpbEhh9jyipgxe19OcubqV5w
April 1, 2024
53904
Pacific island small states
PSS
false
2
1
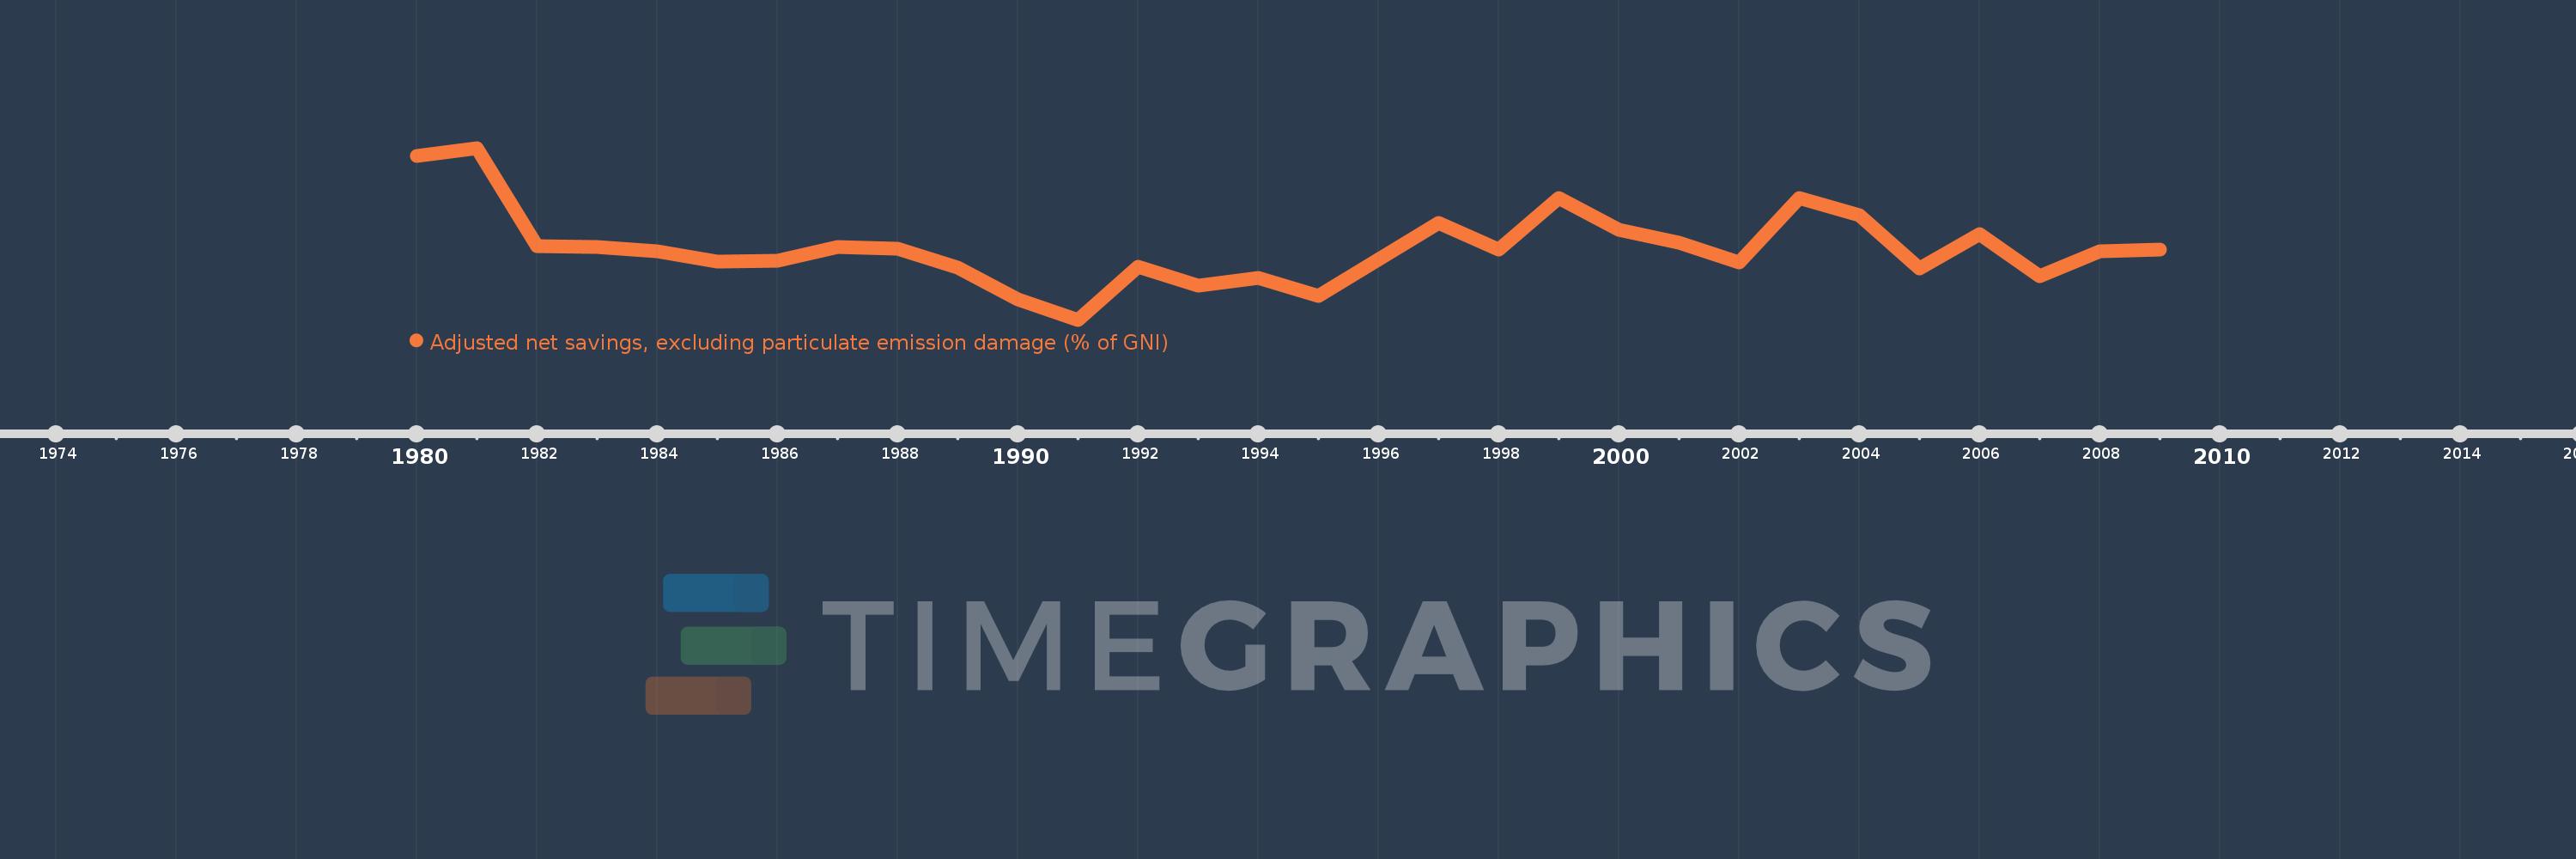
Adjusted net savings, excluding particulate emission damage (% of GNI)
2009,2008,2007,2006,2005,2004,2003,2002,2001,2000,1999,1998,1997,1995,1994,1993,1992,1991,1990,1989,1988,1987,1986,1985,1984,1983,1982,1981,1980
Estas estadísticas en otros países:
AfghanistanAlbaniaAlgeriaAngolaArab WorldArgentinaArmeniaAustraliaAustriaAzerbaijanBahamas, TheBahrainBangladeshBarbadosBelarusBelgiumBelizeBeninBhutanBoliviaBotswanaBrazilBrunei DarussalamBulgariaBurkina FasoBurundiCabo VerdeCambodiaCameroonCanadaCaribbean small statesCentral African RepublicCentral Europe and the BalticsChadChileChinaColombiaComorosCongo, Dem. Rep.Congo, Rep.Costa RicaCote d'IvoireCroatiaCyprusCzech RepublicDenmarkDjiboutiDominicaDominican RepublicEarly-demographic dividendEast Asia & PacificEast Asia & Pacific (excluding high income)East Asia & Pacific (IDA & IBRD countries)EcuadorEgypt, Arab Rep.El SalvadorEquatorial GuineaEritreaEstoniaEthiopiaEuro areaEurope & Central AsiaEurope & Central Asia (excluding high income)Europe & Central Asia (IDA & IBRD countries)European UnionFijiFinlandFragile and conflict affected situationsFranceGabonGambia, TheGeorgiaGermanyGhanaGreeceGuatemalaGuineaGuinea-BissauGuyanaHaitiHeavily indebted poor countries (HIPC)High incomeHondurasHungaryIBRD onlyIcelandIDA & IBRD totalIDA blendIDA onlyIDA totalIndiaIndonesiaIran, Islamic Rep.IraqIrelandIsraelItalyJamaicaJapanJordanKazakhstanKenyaKiribatiKorea, Rep.KuwaitKyrgyz RepublicLao PDRLate-demographic dividendLatin America & Caribbean Latin America & Caribbean (excluding high income)Latin America & the Caribbean (IDA & IBRD countries)LatviaLeast developed countries: UN classificationLebanonLesothoLiberiaLibyaLithuaniaLow & middle incomeLow incomeLower middle incomeLuxembourgMacedonia, FYRMadagascarMalawiMalaysiaMaldivesMaliMauritaniaMauritiusMexicoMiddle East & North AfricaMiddle East & North Africa (excluding high income)Middle East & North Africa (IDA & IBRD countries)Middle incomeMoldovaMongoliaMoroccoMozambiqueNamibiaNepalNetherlandsNew ZealandNicaraguaNigerNigeriaNorth AmericaNorwayOECD membersOmanOther small statesPacific island small statesPakistanPanamaPapua New GuineaParaguayPeruPhilippinesPolandPortugalPost-demographic dividendPre-demographic dividendQatarRomaniaRussian FederationRwandaSaudi ArabiaSenegalSeychellesSierra LeoneSingaporeSlovak RepublicSloveniaSmall statesSolomon IslandsSouth AfricaSouth AsiaSouth Asia (IDA & IBRD)SpainSri LankaSt. LuciaSt. Vincent and the GrenadinesSub-Saharan Africa Sub-Saharan Africa (excluding high income)Sub-Saharan Africa (IDA & IBRD countries)SudanSurinameSwazilandSwedenSwitzerlandSyrian Arab RepublicTajikistanTanzaniaThailandTogoTongaTrinidad and TobagoTunisiaTurkeyUgandaUkraineUnited KingdomUnited StatesUpper middle incomeUruguayVanuatuVenezuela, RBVietnamWorldYemen, Rep.ZambiaZimbabwe línea de tiempo (timeline):
En esta escala de tiempo se presenta un gráfico de 1980 y 2009 de Pacific island small states. Los datos de 1979 están ausentes. El número de observaciones reales por fecha: 29.
Fuente (nombre):
Indicadores del desarrollo mundial
Fuente (organización):
World Bank staff estimates based on sources and methods in World Bank's "The Changing Wealth of Nations: Measuring Sustainable Development in the New Millennium" (2011).
Categorías:
Economy & Growth, Environment
Se ha actualizado:
23 abr 2017 año
Los indicadores de los cambios de valor en los últimos años
Mínimo:
-3.162
1 ene 1991 año
Máximo:
23.363
1 ene 1981 año
A la fecha de observación
Valor
Cambio absoluto
El cambio con respecto al valor anterior
1 ene 1980 año
22.159
+22.159
0.0%
1 ene 1981 año
23.363
+1.204
5.43%
1 ene 1982 año
8.188
-15.175
-64.95%
1 ene 1983 año
8.087
-0.102
-1.24%
1 ene 1984 año
7.348
-0.739
-9.14%
1 ene 1985 año
5.751
-1.596
-21.73%
1 ene 1986 año
5.902
+0.151
2.63%
1 ene 1987 año
8.042
+2.14
36.26%
1 ene 1988 año
7.772
-0.27
-3.35%
1 ene 1989 año
4.846
-2.927
-37.65%
1 ene 1990 año
-0.069
-4.915
-101.43%
1 ene 1991 año
-3.162
-3.092
4.47 mil%
1 ene 1992 año
5.003
+8.165
-258.25%
1 ene 1993 año
2.058
-2.946
-58.87%
1 ene 1994 año
3.304
+1.246
60.56%
1 ene 1995 año
0.513
-2.791
-84.48%
1 ene 1997 año
11.794
+11.281
2.2 mil%
1 ene 1998 año
7.714
-4.08
-34.59%
1 ene 1999 año
15.609
+7.895
102.34%
1 ene 2000 año
10.712
-4.897
-31.37%
1 ene 2001 año
8.793
-1.919
-17.92%
1 ene 2002 año
5.629
-3.164
-35.98%
1 ene 2003 año
15.69
+10.062
178.76%
1 ene 2004 año
13.016
-2.675
-17.05%
1 ene 2005 año
4.72
-8.295
-63.73%
1 ene 2006 año
10.005
+5.284
111.95%
1 ene 2007 año
3.555
-6.45
-64.47%
1 ene 2008 año
7.41
+3.855
108.44%
1 ene 2009 año
7.693
+0.283
3.82%
Ranking de los países por los datos estadísticos actuales


Comentarios: