29
/es/
es
AIzaSyAYiBZKx7MnpbEhh9jyipgxe19OcubqV5w
April 1, 2024
212553
Nigeria
NGA
true
2
1
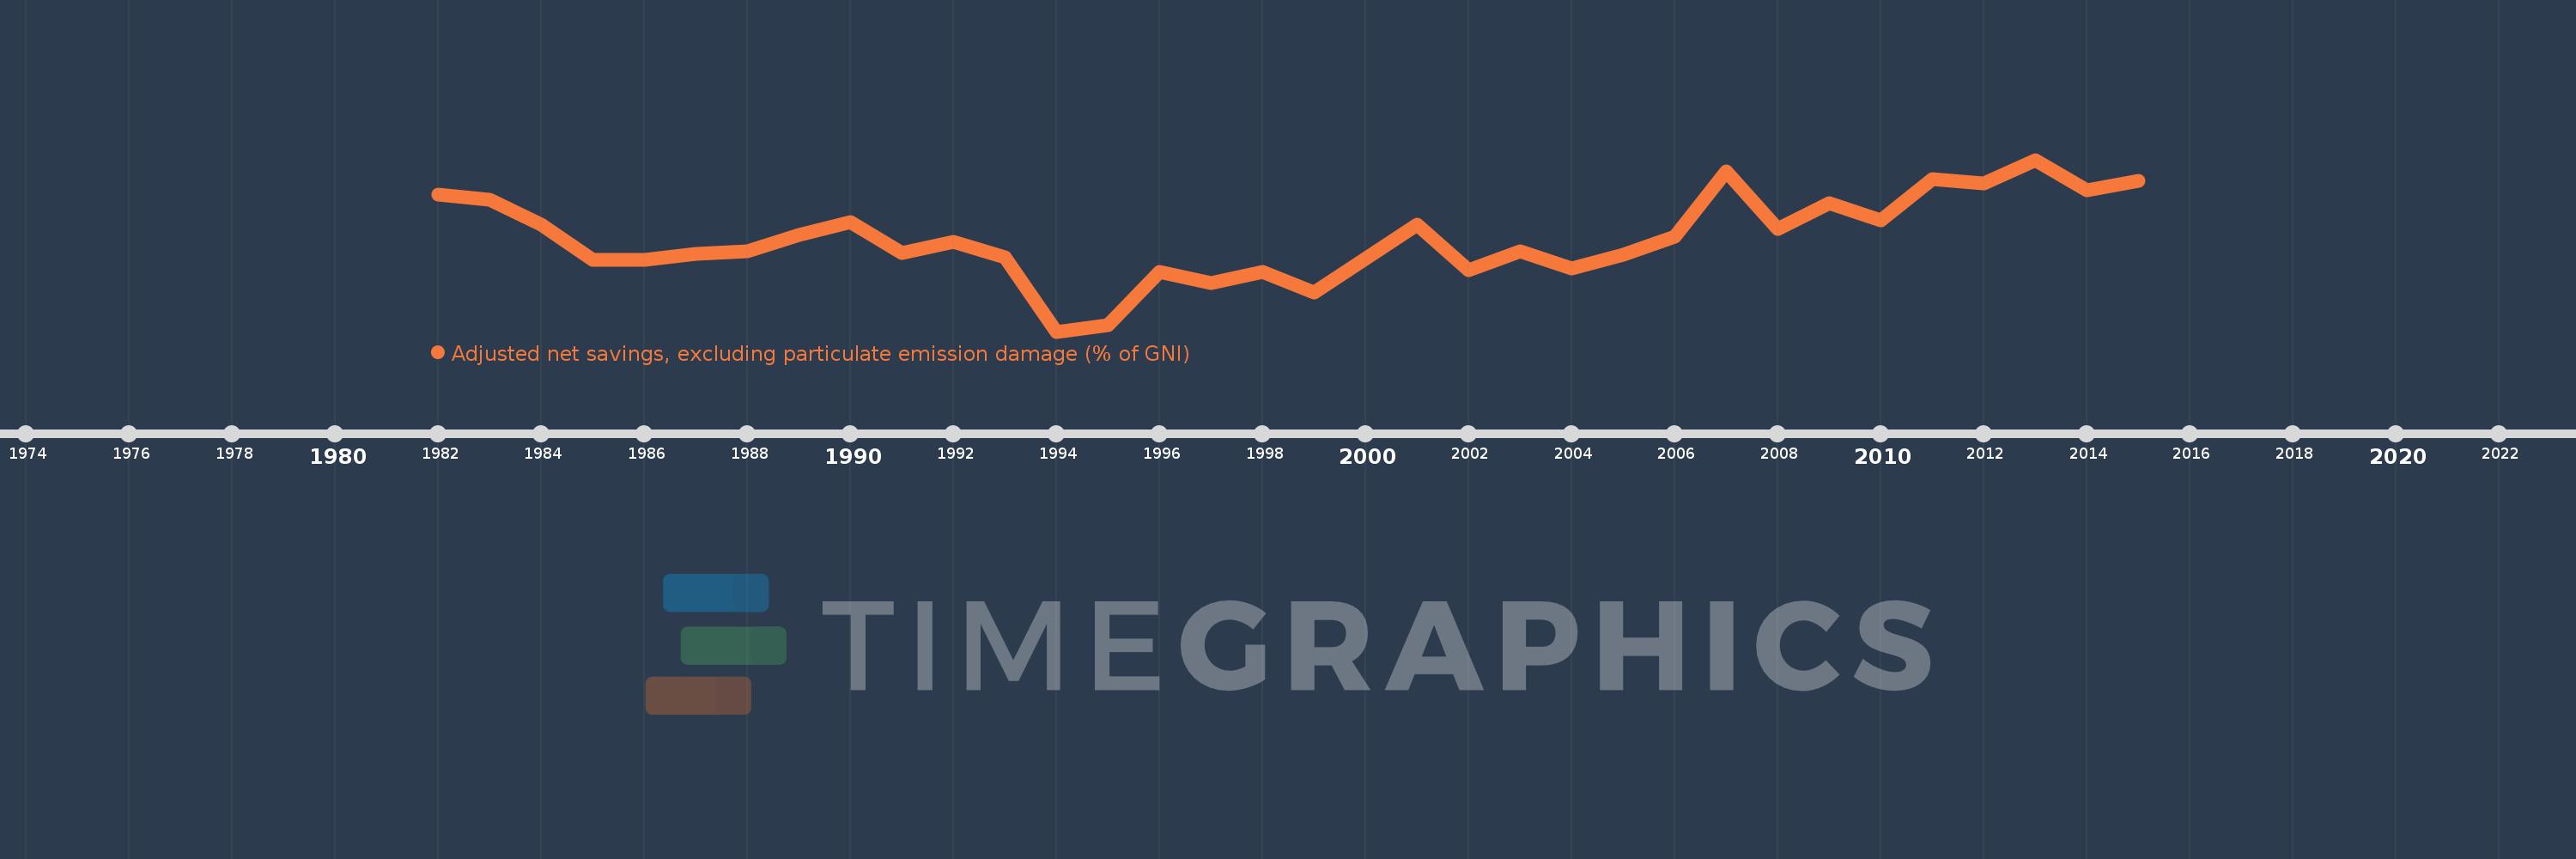
Adjusted net savings, excluding particulate emission damage (% of GNI)
2015,2014,2013,2012,2011,2010,2009,2008,2007,2006,2005,2004,2003,2002,2001,1999,1998,1997,1996,1995,1994,1993,1992,1991,1990,1989,1988,1987,1986,1985,1984,1983,1982
Estas estadísticas en otros países:
AfghanistanAlbaniaAlgeriaAngolaArab WorldArgentinaArmeniaAustraliaAustriaAzerbaijanBahamas, TheBahrainBangladeshBarbadosBelarusBelgiumBelizeBeninBhutanBoliviaBotswanaBrazilBrunei DarussalamBulgariaBurkina FasoBurundiCabo VerdeCambodiaCameroonCanadaCaribbean small statesCentral African RepublicCentral Europe and the BalticsChadChileChinaColombiaComorosCongo, Dem. Rep.Congo, Rep.Costa RicaCote d'IvoireCroatiaCyprusCzech RepublicDenmarkDjiboutiDominicaDominican RepublicEarly-demographic dividendEast Asia & PacificEast Asia & Pacific (excluding high income)East Asia & Pacific (IDA & IBRD countries)EcuadorEgypt, Arab Rep.El SalvadorEquatorial GuineaEritreaEstoniaEthiopiaEuro areaEurope & Central AsiaEurope & Central Asia (excluding high income)Europe & Central Asia (IDA & IBRD countries)European UnionFijiFinlandFragile and conflict affected situationsFranceGabonGambia, TheGeorgiaGermanyGhanaGreeceGuatemalaGuineaGuinea-BissauGuyanaHaitiHeavily indebted poor countries (HIPC)High incomeHondurasHungaryIBRD onlyIcelandIDA & IBRD totalIDA blendIDA onlyIDA totalIndiaIndonesiaIran, Islamic Rep.IraqIrelandIsraelItalyJamaicaJapanJordanKazakhstanKenyaKiribatiKorea, Rep.KuwaitKyrgyz RepublicLao PDRLate-demographic dividendLatin America & Caribbean Latin America & Caribbean (excluding high income)Latin America & the Caribbean (IDA & IBRD countries)LatviaLeast developed countries: UN classificationLebanonLesothoLiberiaLibyaLithuaniaLow & middle incomeLow incomeLower middle incomeLuxembourgMacedonia, FYRMadagascarMalawiMalaysiaMaldivesMaliMauritaniaMauritiusMexicoMiddle East & North AfricaMiddle East & North Africa (excluding high income)Middle East & North Africa (IDA & IBRD countries)Middle incomeMoldovaMongoliaMoroccoMozambiqueNamibiaNepalNetherlandsNew ZealandNicaraguaNigerNigeriaNorth AmericaNorwayOECD membersOmanOther small statesPacific island small statesPakistanPanamaPapua New GuineaParaguayPeruPhilippinesPolandPortugalPost-demographic dividendPre-demographic dividendQatarRomaniaRussian FederationRwandaSaudi ArabiaSenegalSeychellesSierra LeoneSingaporeSlovak RepublicSloveniaSmall statesSolomon IslandsSouth AfricaSouth AsiaSouth Asia (IDA & IBRD)SpainSri LankaSt. LuciaSt. Vincent and the GrenadinesSub-Saharan Africa Sub-Saharan Africa (excluding high income)Sub-Saharan Africa (IDA & IBRD countries)SudanSurinameSwazilandSwedenSwitzerlandSyrian Arab RepublicTajikistanTanzaniaThailandTogoTongaTrinidad and TobagoTunisiaTurkeyUgandaUkraineUnited KingdomUnited StatesUpper middle incomeUruguayVanuatuVenezuela, RBVietnamWorldYemen, Rep.ZambiaZimbabwe línea de tiempo (timeline):
En esta escala de tiempo se presenta un gráfico de 1982 y 2015 de Nigeria. Los datos de 1981 están ausentes. El número de observaciones reales por fecha: 33.
Fuente (nombre):
Indicadores del desarrollo mundial
Fuente (organización):
World Bank staff estimates based on sources and methods in World Bank's "The Changing Wealth of Nations: Measuring Sustainable Development in the New Millennium" (2011).
Categorías:
Economy & Growth, Environment
Se ha actualizado:
23 abr 2017 año
Los indicadores de los cambios de valor en los últimos años
Mínimo:
-46.479
1 ene 1994 año
Máximo:
20.216
1 ene 2013 año
A la fecha de observación
Valor
Cambio absoluto
El cambio con respecto al valor anterior
1 ene 1982 año
6.718
+6.718
0.0%
1 ene 1983 año
4.571
-2.147
-31.96%
1 ene 1984 año
-4.825
-9.396
-205.55%
1 ene 1985 año
-18.746
-13.921
288.53%
1 ene 1986 año
-18.711
+0.036
-0.19%
1 ene 1987 año
-16.356
+2.354
-12.58%
1 ene 1988 año
-15.226
+1.13
-6.91%
1 ene 1989 año
-8.92
+6.306
-41.42%
1 ene 1990 año
-3.851
+5.069
-56.83%
1 ene 1991 año
-15.9
-12.049
312.86%
1 ene 1992 año
-11.727
+4.173
-26.25%
1 ene 1993 año
-17.753
-6.026
51.39%
1 ene 1994 año
-46.479
-28.725
161.8%
1 ene 1995 año
-43.897
+2.582
-5.56%
1 ene 1996 año
-23.22
+20.677
-47.1%
1 ene 1997 año
-27.752
-4.532
19.52%
1 ene 1998 año
-23.43
+4.322
-15.58%
1 ene 1999 año
-31.322
-7.893
33.69%
1 ene 2001 año
-4.901
+26.421
-84.35%
1 ene 2002 año
-22.646
-17.744
362.01%
1 ene 2003 año
-15.246
+7.4
-32.68%
1 ene 2004 año
-21.915
-6.669
43.74%
1 ene 2005 año
-16.499
+5.415
-24.71%
1 ene 2006 año
-9.604
+6.896
-41.79%
1 ene 2007 año
15.581
+25.185
-262.24%
1 ene 2008 año
-6.551
-22.133
-142.05%
1 ene 2009 año
3.441
+9.992
-152.52%
1 ene 2010 año
-3.354
-6.794
-197.48%
1 ene 2011 año
12.642
+15.996
-476.97%
1 ene 2012 año
11.212
-1.431
-11.32%
1 ene 2013 año
20.216
+9.004
80.31%
1 ene 2014 año
8.49
-11.726
-58.01%
1 ene 2015 año
12.167
+3.677
43.31%
Ranking de los países por los datos estadísticos actuales


Comentarios: