29
/es/
es
AIzaSyAYiBZKx7MnpbEhh9jyipgxe19OcubqV5w
April 1, 2024
213991
Norway
NOR
true
2
1
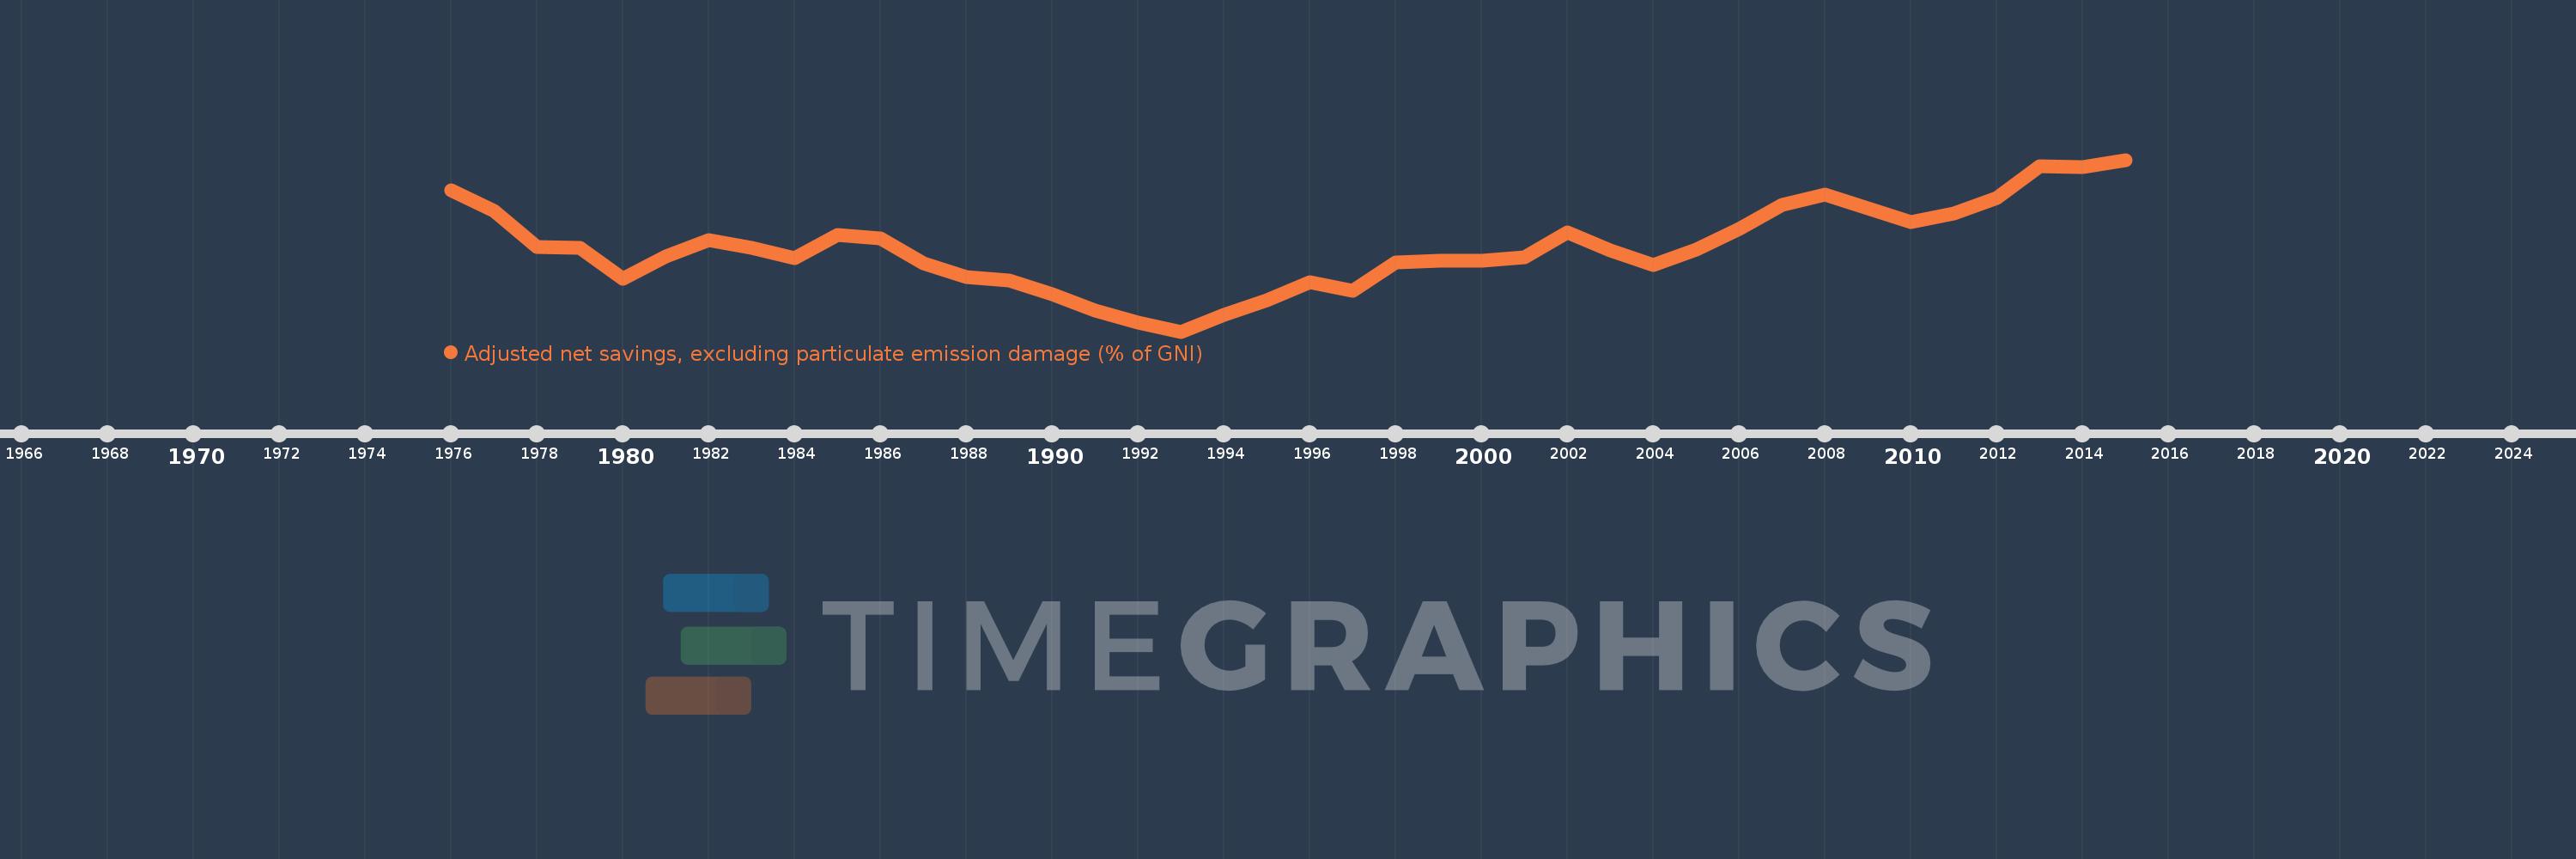
Adjusted net savings, excluding particulate emission damage (% of GNI)
2015,2014,2013,2012,2011,2010,2009,2008,2007,2006,2005,2004,2003,2002,2001,2000,1999,1998,1997,1996,1995,1994,1993,1992,1991,1990,1989,1988,1987,1986,1985,1984,1983,1982,1981,1980,1979,1978,1977,1976
Estas estadísticas en otros países:
AfghanistanAlbaniaAlgeriaAngolaArab WorldArgentinaArmeniaAustraliaAustriaAzerbaijanBahamas, TheBahrainBangladeshBarbadosBelarusBelgiumBelizeBeninBhutanBoliviaBotswanaBrazilBrunei DarussalamBulgariaBurkina FasoBurundiCabo VerdeCambodiaCameroonCanadaCaribbean small statesCentral African RepublicCentral Europe and the BalticsChadChileChinaColombiaComorosCongo, Dem. Rep.Congo, Rep.Costa RicaCote d'IvoireCroatiaCyprusCzech RepublicDenmarkDjiboutiDominicaDominican RepublicEarly-demographic dividendEast Asia & PacificEast Asia & Pacific (excluding high income)East Asia & Pacific (IDA & IBRD countries)EcuadorEgypt, Arab Rep.El SalvadorEquatorial GuineaEritreaEstoniaEthiopiaEuro areaEurope & Central AsiaEurope & Central Asia (excluding high income)Europe & Central Asia (IDA & IBRD countries)European UnionFijiFinlandFragile and conflict affected situationsFranceGabonGambia, TheGeorgiaGermanyGhanaGreeceGuatemalaGuineaGuinea-BissauGuyanaHaitiHeavily indebted poor countries (HIPC)High incomeHondurasHungaryIBRD onlyIcelandIDA & IBRD totalIDA blendIDA onlyIDA totalIndiaIndonesiaIran, Islamic Rep.IraqIrelandIsraelItalyJamaicaJapanJordanKazakhstanKenyaKiribatiKorea, Rep.KuwaitKyrgyz RepublicLao PDRLate-demographic dividendLatin America & Caribbean Latin America & Caribbean (excluding high income)Latin America & the Caribbean (IDA & IBRD countries)LatviaLeast developed countries: UN classificationLebanonLesothoLiberiaLibyaLithuaniaLow & middle incomeLow incomeLower middle incomeLuxembourgMacedonia, FYRMadagascarMalawiMalaysiaMaldivesMaliMauritaniaMauritiusMexicoMiddle East & North AfricaMiddle East & North Africa (excluding high income)Middle East & North Africa (IDA & IBRD countries)Middle incomeMoldovaMongoliaMoroccoMozambiqueNamibiaNepalNetherlandsNew ZealandNicaraguaNigerNigeriaNorth AmericaNorwayOECD membersOmanOther small statesPacific island small statesPakistanPanamaPapua New GuineaParaguayPeruPhilippinesPolandPortugalPost-demographic dividendPre-demographic dividendQatarRomaniaRussian FederationRwandaSaudi ArabiaSenegalSeychellesSierra LeoneSingaporeSlovak RepublicSloveniaSmall statesSolomon IslandsSouth AfricaSouth AsiaSouth Asia (IDA & IBRD)SpainSri LankaSt. LuciaSt. Vincent and the GrenadinesSub-Saharan Africa Sub-Saharan Africa (excluding high income)Sub-Saharan Africa (IDA & IBRD countries)SudanSurinameSwazilandSwedenSwitzerlandSyrian Arab RepublicTajikistanTanzaniaThailandTogoTongaTrinidad and TobagoTunisiaTurkeyUgandaUkraineUnited KingdomUnited StatesUpper middle incomeUruguayVanuatuVenezuela, RBVietnamWorldYemen, Rep.ZambiaZimbabwe línea de tiempo (timeline):
En esta escala de tiempo se presenta un gráfico de 1976 y 2015 de Norway. Los datos de 1975 están ausentes. El número de observaciones reales por fecha: 40.
Fuente (nombre):
Indicadores del desarrollo mundial
Fuente (organización):
World Bank staff estimates based on sources and methods in World Bank's "The Changing Wealth of Nations: Measuring Sustainable Development in the New Millennium" (2011).
Categorías:
Economy & Growth, Environment
Se ha actualizado:
23 abr 2017 año
Los indicadores de los cambios de valor en los últimos años
Mínimo:
4.757
1 ene 1993 año
Máximo:
21.004
1 ene 2015 año
A la fecha de observación
Valor
Cambio absoluto
El cambio con respecto al valor anterior
1 ene 1976 año
18.114
+18.114
0.0%
1 ene 1977 año
16.195
-1.919
-10.6%
1 ene 1978 año
12.778
-3.416
-21.09%
1 ene 1979 año
12.688
-0.091
-0.71%
1 ene 1980 año
9.732
-2.956
-23.3%
1 ene 1981 año
11.899
+2.168
22.27%
1 ene 1982 año
13.393
+1.494
12.55%
1 ene 1983 año
12.718
-0.674
-5.04%
1 ene 1984 año
11.741
-0.977
-7.68%
1 ene 1985 año
13.888
+2.147
18.28%
1 ene 1986 año
13.564
-0.323
-2.33%
1 ene 1987 año
11.194
-2.371
-17.48%
1 ene 1988 año
9.881
-1.313
-11.73%
1 ene 1989 año
9.612
-0.269
-2.72%
1 ene 1990 año
8.289
-1.323
-13.76%
1 ene 1991 año
6.753
-1.536
-18.54%
1 ene 1992 año
5.64
-1.113
-16.48%
1 ene 1993 año
4.757
-0.883
-15.65%
1 ene 1994 año
6.375
+1.618
34.02%
1 ene 1995 año
7.722
+1.347
21.13%
1 ene 1996 año
9.442
+1.72
22.27%
1 ene 1997 año
8.591
-0.851
-9.01%
1 ene 1998 año
11.273
+2.682
31.22%
1 ene 1999 año
11.497
+0.223
1.98%
1 ene 2000 año
11.425
-0.072
-0.62%
1 ene 2001 año
11.797
+0.372
3.26%
1 ene 2002 año
14.126
+2.329
19.74%
1 ene 2003 año
12.448
-1.678
-11.88%
1 ene 2004 año
11.022
-1.425
-11.45%
1 ene 2005 año
12.478
+1.455
13.2%
1 ene 2006 año
14.434
+1.957
15.68%
1 ene 2007 año
16.779
+2.345
16.24%
1 ene 2008 año
17.716
+0.936
5.58%
1 ene 2009 año
16.425
-1.291
-7.29%
1 ene 2010 año
15.082
-1.343
-8.18%
1 ene 2011 año
15.939
+0.857
5.68%
1 ene 2012 año
17.421
+1.482
9.3%
1 ene 2013 año
20.416
+2.995
17.19%
1 ene 2014 año
20.314
-0.102
-0.5%
1 ene 2015 año
21.004
+0.69
3.39%
Ranking de los países por los datos estadísticos actuales


Comentarios: