29
/es/
es
AIzaSyAYiBZKx7MnpbEhh9jyipgxe19OcubqV5w
April 1, 2024
52879
OECD members
OED
false
2
1
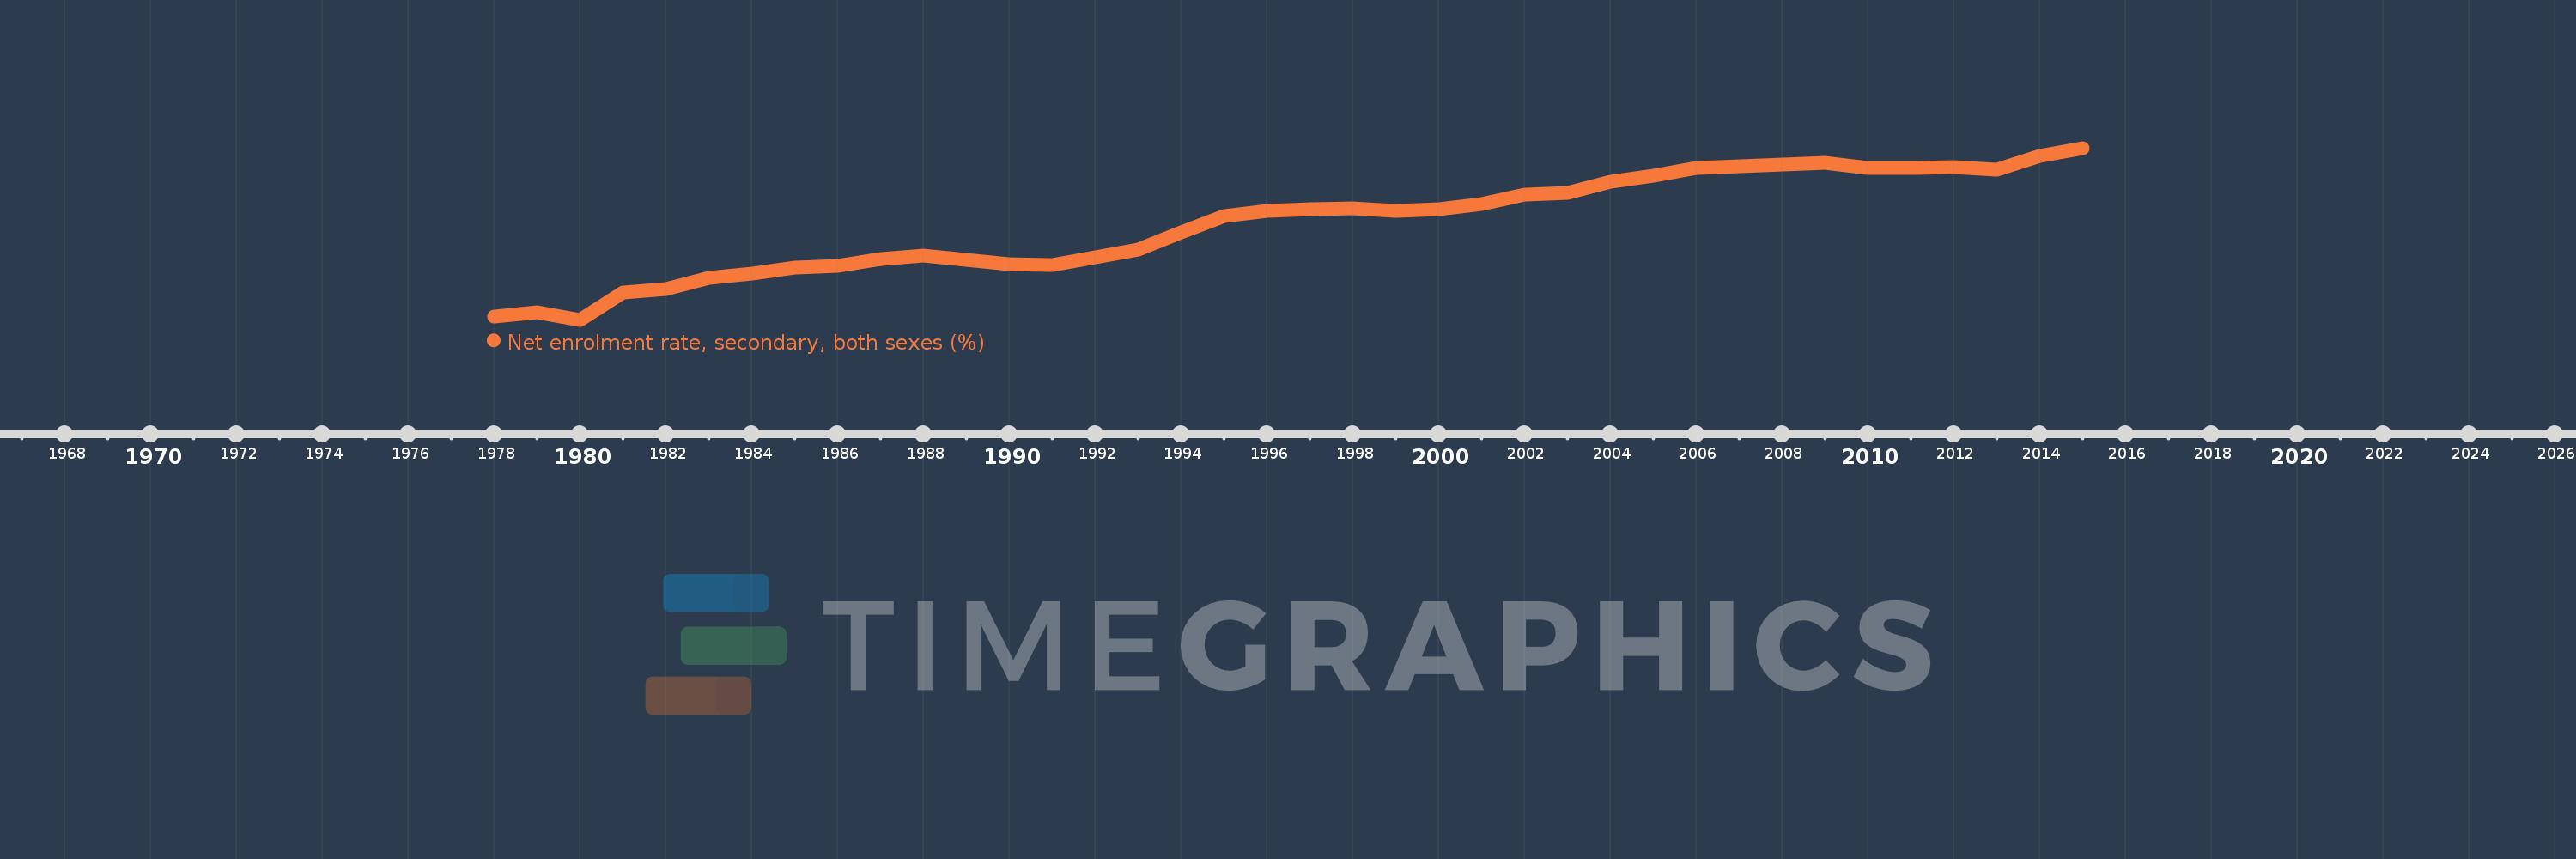
Net enrolment rate, secondary, both sexes (%)
2015,2014,2013,2012,2011,2010,2009,2008,2007,2006,2005,2004,2003,2002,2001,2000,1999,1998,1997,1996,1995,1994,1993,1992,1991,1990,1989,1988,1987,1986,1985,1984,1983,1982,1981,1980,1979,1978
Estas estadísticas en otros países:
AfghanistanAlbaniaAlgeriaAngolaAntigua and BarbudaArab WorldArgentinaArmeniaArubaAustraliaAustriaAzerbaijanBahamas, TheBahrainBangladeshBarbadosBelarusBelgiumBelizeBeninBermudaBhutanBoliviaBotswanaBrazilBritish Virgin IslandsBrunei DarussalamBulgariaBurkina FasoBurundiCabo VerdeCambodiaCameroonCanadaCaribbean small statesCentral African RepublicCentral Europe and the BalticsChadChileColombiaComorosCongo, Dem. Rep.Congo, Rep.Costa RicaCroatiaCubaCyprusDenmarkDjiboutiDominicaDominican RepublicEarly-demographic dividendEast Asia & PacificEast Asia & Pacific (excluding high income)East Asia & Pacific (IDA & IBRD countries)EcuadorEgypt, Arab Rep.El SalvadorEquatorial GuineaEritreaEstoniaEthiopiaEuro areaEurope & Central AsiaEurope & Central Asia (excluding high income)Europe & Central Asia (IDA & IBRD countries)European UnionFijiFinlandFragile and conflict affected situationsFranceGambia, TheGeorgiaGhanaGreeceGrenadaGuatemalaGuineaGuinea-BissauGuyanaHeavily indebted poor countries (HIPC)High incomeHondurasHong Kong SAR, ChinaHungaryIBRD onlyIcelandIDA & IBRD totalIDA blendIDA onlyIDA totalIndiaIndonesiaIran, Islamic Rep.IraqIrelandIsraelItalyJamaicaJapanJordanKazakhstanKenyaKiribatiKorea, Dem. People’s Rep.Korea, Rep.KuwaitKyrgyz RepublicLao PDRLate-demographic dividendLatin America & Caribbean Latin America & Caribbean (excluding high income)Latin America & the Caribbean (IDA & IBRD countries)LatviaLeast developed countries: UN classificationLebanonLesothoLibyaLiechtensteinLithuaniaLow & middle incomeLow incomeLower middle incomeLuxembourgMacao SAR, ChinaMacedonia, FYRMadagascarMalawiMalaysiaMaldivesMaliMaltaMarshall IslandsMauritaniaMauritiusMexicoMiddle East & North AfricaMiddle East & North Africa (excluding high income)Middle East & North Africa (IDA & IBRD countries)Middle incomeMoldovaMongoliaMoroccoMozambiqueMyanmarNamibiaNauruNepalNetherlandsNew ZealandNicaraguaNigerNorth AmericaNorwayOECD membersOmanOther small statesPacific island small statesPakistanPanamaParaguayPeruPhilippinesPolandPortugalPost-demographic dividendPre-demographic dividendPuerto RicoQatarRomaniaSamoaSao Tome and PrincipeSaudi ArabiaSenegalSerbiaSeychellesSierra LeoneSloveniaSmall statesSolomon IslandsSomaliaSouth AfricaSouth AsiaSouth Asia (IDA & IBRD)SpainSri LankaSt. Kitts and NevisSt. LuciaSt. Vincent and the GrenadinesSub-Saharan Africa Sub-Saharan Africa (excluding high income)Sub-Saharan Africa (IDA & IBRD countries)SurinameSwazilandSwedenSwitzerlandSyrian Arab RepublicTajikistanThailandTimor-LesteTogoTongaTrinidad and TobagoTunisiaTurkeyTuvaluUgandaUkraineUnited Arab EmiratesUnited KingdomUnited StatesUpper middle incomeUruguayVanuatuVenezuela, RBVietnamWest Bank and GazaWorldYemen, Rep.Zimbabwe línea de tiempo (timeline):
En esta escala de tiempo se presenta un gráfico de 1978 y 2015 de OECD members. Los datos de 1977 están ausentes. El número de observaciones reales por fecha: 38.
Fuente (nombre):
Indicadores del desarrollo mundial
Fuente (organización):
UNESCO Institute for Statistics
Categorías:
Education
Se ha actualizado:
23 abr 2017 año
Los indicadores de los cambios de valor en los últimos años
Mínimo:
70.097
1 ene 1980 año
Máximo:
89.191
1 ene 2015 año
A la fecha de observación
Valor
Cambio absoluto
El cambio con respecto al valor anterior
1 ene 1978 año
70.437
+70.437
0.0%
1 ene 1979 año
70.899
+0.462
0.66%
1 ene 1980 año
70.097
-0.802
-1.13%
1 ene 1981 año
73.151
+3.054
4.36%
1 ene 1982 año
73.481
+0.329
0.45%
1 ene 1983 año
74.732
+1.252
1.7%
1 ene 1984 año
75.19
+0.457
0.61%
1 ene 1985 año
75.924
+0.735
0.98%
1 ene 1986 año
76.063
+0.139
0.18%
1 ene 1987 año
76.894
+0.831
1.09%
1 ene 1988 año
77.188
+0.295
0.38%
1 ene 1989 año
76.741
-0.448
-0.58%
1 ene 1990 año
76.321
-0.42
-0.55%
1 ene 1991 año
76.169
-0.152
-0.2%
1 ene 1992 año
76.996
+0.827
1.09%
1 ene 1993 año
77.906
+0.91
1.18%
1 ene 1994 año
79.789
+1.883
2.42%
1 ene 1995 año
81.592
+1.803
2.26%
1 ene 1996 año
82.151
+0.559
0.69%
1 ene 1997 año
82.397
+0.246
0.3%
1 ene 1998 año
82.494
+0.097
0.12%
1 ene 1999 año
82.216
-0.278
-0.34%
1 ene 2000 año
82.359
+0.143
0.17%
1 ene 2001 año
82.956
+0.597
0.72%
1 ene 2002 año
84.053
+1.098
1.32%
1 ene 2003 año
84.194
+0.14
0.17%
1 ene 2004 año
85.472
+1.279
1.52%
1 ene 2005 año
86.1
+0.628
0.74%
1 ene 2006 año
86.935
+0.834
0.97%
1 ene 2007 año
87.187
+0.253
0.29%
1 ene 2008 año
87.303
+0.116
0.13%
1 ene 2009 año
87.508
+0.204
0.23%
1 ene 2010 año
86.919
-0.589
-0.67%
1 ene 2011 año
86.986
+0.068
0.08%
1 ene 2012 año
87.058
+0.071
0.08%
1 ene 2013 año
86.812
-0.246
-0.28%
1 ene 2014 año
88.289
+1.477
1.7%
1 ene 2015 año
89.191
+0.902
1.02%
Ranking de los países por los datos estadísticos actuales


Comentarios: