29
/es/
es
AIzaSyAYiBZKx7MnpbEhh9jyipgxe19OcubqV5w
April 1, 2024
50283
Middle East & North Africa (IDA & IBRD countries)
TMN
false
2
1
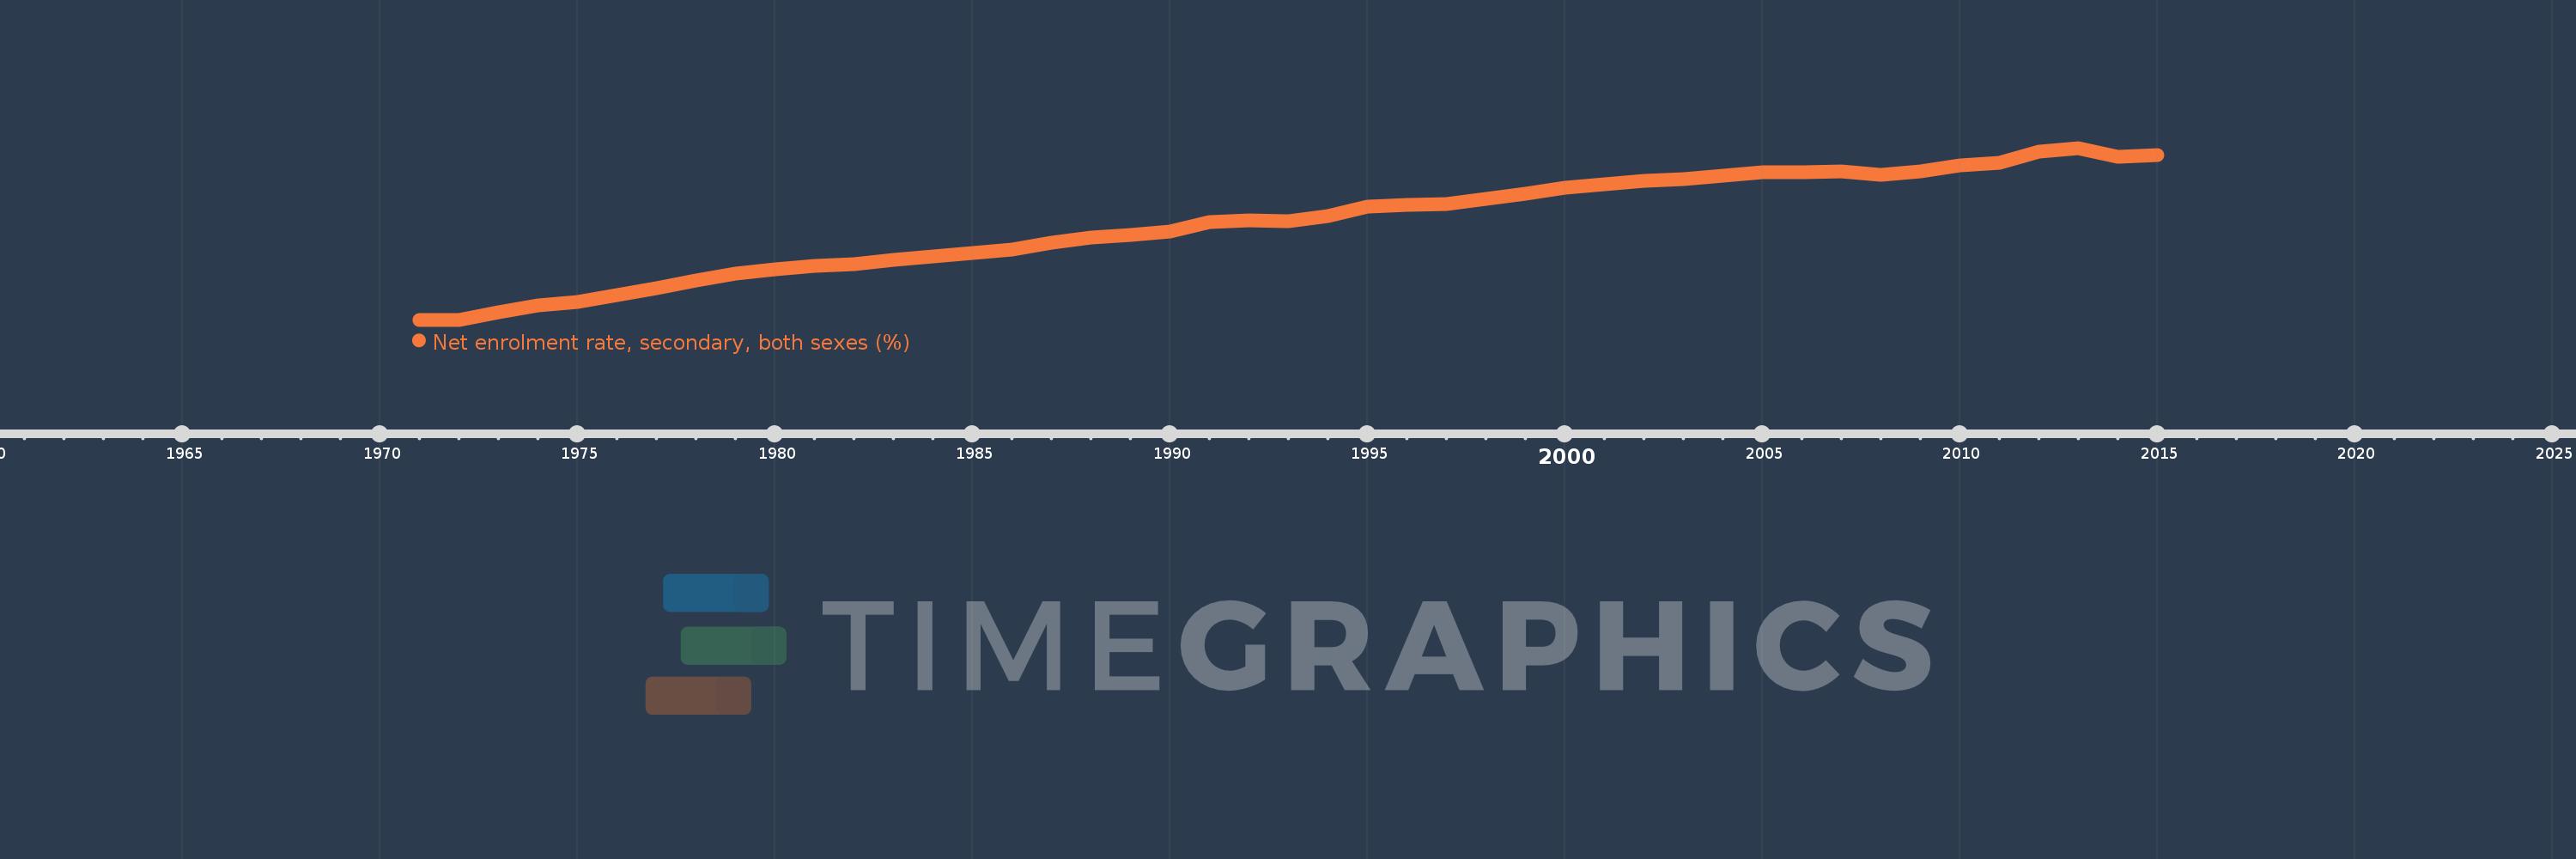
Net enrolment rate, secondary, both sexes (%)
2015,2014,2013,2012,2011,2010,2009,2008,2007,2006,2005,2004,2003,2002,2001,2000,1999,1998,1997,1996,1995,1994,1993,1992,1991,1990,1989,1988,1987,1986,1985,1984,1983,1982,1981,1980,1979,1978,1977,1976,1975,1974,1973,1972,1971
Estas estadísticas en otros países:
AfghanistanAlbaniaAlgeriaAngolaAntigua and BarbudaArab WorldArgentinaArmeniaArubaAustraliaAustriaAzerbaijanBahamas, TheBahrainBangladeshBarbadosBelarusBelgiumBelizeBeninBermudaBhutanBoliviaBotswanaBrazilBritish Virgin IslandsBrunei DarussalamBulgariaBurkina FasoBurundiCabo VerdeCambodiaCameroonCanadaCaribbean small statesCentral African RepublicCentral Europe and the BalticsChadChileColombiaComorosCongo, Dem. Rep.Congo, Rep.Costa RicaCroatiaCubaCyprusDenmarkDjiboutiDominicaDominican RepublicEarly-demographic dividendEast Asia & PacificEast Asia & Pacific (excluding high income)East Asia & Pacific (IDA & IBRD countries)EcuadorEgypt, Arab Rep.El SalvadorEquatorial GuineaEritreaEstoniaEthiopiaEuro areaEurope & Central AsiaEurope & Central Asia (excluding high income)Europe & Central Asia (IDA & IBRD countries)European UnionFijiFinlandFragile and conflict affected situationsFranceGambia, TheGeorgiaGhanaGreeceGrenadaGuatemalaGuineaGuinea-BissauGuyanaHeavily indebted poor countries (HIPC)High incomeHondurasHong Kong SAR, ChinaHungaryIBRD onlyIcelandIDA & IBRD totalIDA blendIDA onlyIDA totalIndiaIndonesiaIran, Islamic Rep.IraqIrelandIsraelItalyJamaicaJapanJordanKazakhstanKenyaKiribatiKorea, Dem. People’s Rep.Korea, Rep.KuwaitKyrgyz RepublicLao PDRLate-demographic dividendLatin America & Caribbean Latin America & Caribbean (excluding high income)Latin America & the Caribbean (IDA & IBRD countries)LatviaLeast developed countries: UN classificationLebanonLesothoLibyaLiechtensteinLithuaniaLow & middle incomeLow incomeLower middle incomeLuxembourgMacao SAR, ChinaMacedonia, FYRMadagascarMalawiMalaysiaMaldivesMaliMaltaMarshall IslandsMauritaniaMauritiusMexicoMiddle East & North AfricaMiddle East & North Africa (excluding high income)Middle East & North Africa (IDA & IBRD countries)Middle incomeMoldovaMongoliaMoroccoMozambiqueMyanmarNamibiaNauruNepalNetherlandsNew ZealandNicaraguaNigerNorth AmericaNorwayOECD membersOmanOther small statesPacific island small statesPakistanPanamaParaguayPeruPhilippinesPolandPortugalPost-demographic dividendPre-demographic dividendPuerto RicoQatarRomaniaSamoaSao Tome and PrincipeSaudi ArabiaSenegalSerbiaSeychellesSierra LeoneSloveniaSmall statesSolomon IslandsSomaliaSouth AfricaSouth AsiaSouth Asia (IDA & IBRD)SpainSri LankaSt. Kitts and NevisSt. LuciaSt. Vincent and the GrenadinesSub-Saharan Africa Sub-Saharan Africa (excluding high income)Sub-Saharan Africa (IDA & IBRD countries)SurinameSwazilandSwedenSwitzerlandSyrian Arab RepublicTajikistanThailandTimor-LesteTogoTongaTrinidad and TobagoTunisiaTurkeyTuvaluUgandaUkraineUnited Arab EmiratesUnited KingdomUnited StatesUpper middle incomeUruguayVanuatuVenezuela, RBVietnamWest Bank and GazaWorldYemen, Rep.Zimbabwe línea de tiempo (timeline):
En esta escala de tiempo se presenta un gráfico de 1971 y 2015 de Middle East & North Africa (IDA & IBRD countries). Los datos de 1970 están ausentes. El número de observaciones reales por fecha: 45.
Fuente (nombre):
Indicadores del desarrollo mundial
Fuente (organización):
UNESCO Institute for Statistics
Categorías:
Education
Se ha actualizado:
23 abr 2017 año
Los indicadores de los cambios de valor en los últimos años
Mínimo:
20.784
1 ene 1972 año
Máximo:
71.038
1 ene 2013 año
A la fecha de observación
Valor
Cambio absoluto
El cambio con respecto al valor anterior
1 ene 1971 año
20.813
+20.813
0.0%
1 ene 1972 año
20.784
-0.028
-0.14%
1 ene 1973 año
23.081
+2.296
11.05%
1 ene 1974 año
24.906
+1.826
7.91%
1 ene 1975 año
25.943
+1.036
4.16%
1 ene 1976 año
28.03
+2.087
8.05%
1 ene 1977 año
30.111
+2.082
7.43%
1 ene 1978 año
32.277
+2.166
7.19%
1 ene 1979 año
34.352
+2.075
6.43%
1 ene 1980 año
35.647
+1.295
3.77%
1 ene 1981 año
36.542
+0.895
2.51%
1 ene 1982 año
37.098
+0.555
1.52%
1 ene 1983 año
38.382
+1.285
3.46%
1 ene 1984 año
39.271
+0.889
2.32%
1 ene 1985 año
40.273
+1.002
2.55%
1 ene 1986 año
41.434
+1.161
2.88%
1 ene 1987 año
43.41
+1.976
4.77%
1 ene 1988 año
44.774
+1.364
3.14%
1 ene 1989 año
45.459
+0.685
1.53%
1 ene 1990 año
46.589
+1.13
2.49%
1 ene 1991 año
49.258
+2.669
5.73%
1 ene 1992 año
49.734
+0.475
0.97%
1 ene 1993 año
49.677
-0.056
-0.11%
1 ene 1994 año
51.223
+1.546
3.11%
1 ene 1995 año
53.808
+2.585
5.05%
1 ene 1996 año
54.294
+0.486
0.9%
1 ene 1997 año
54.65
+0.356
0.66%
1 ene 1998 año
56.119
+1.47
2.69%
1 ene 1999 año
57.737
+1.618
2.88%
1 ene 2000 año
59.304
+1.567
2.71%
1 ene 2001 año
60.399
+1.095
1.85%
1 ene 2002 año
61.305
+0.906
1.5%
1 ene 2003 año
61.934
+0.63
1.03%
1 ene 2004 año
62.995
+1.061
1.71%
1 ene 2005 año
64.041
+1.046
1.66%
1 ene 2006 año
63.846
-0.195
-0.3%
1 ene 2007 año
64.117
+0.271
0.42%
1 ene 2008 año
63.159
-0.958
-1.49%
1 ene 2009 año
64.254
+1.095
1.73%
1 ene 2010 año
65.862
+1.607
2.5%
1 ene 2011 año
66.748
+0.887
1.35%
1 ene 2012 año
69.901
+3.153
4.72%
1 ene 2013 año
71.038
+1.137
1.63%
1 ene 2014 año
68.373
-2.665
-3.75%
1 ene 2015 año
68.937
+0.564
0.83%
Ranking de los países por los datos estadísticos actuales


Comentarios: