29
/es/
es
AIzaSyAYiBZKx7MnpbEhh9jyipgxe19OcubqV5w
April 1, 2024
43709
Latin America & the Caribbean (IDA & IBRD countries)
TLA
false
2
1
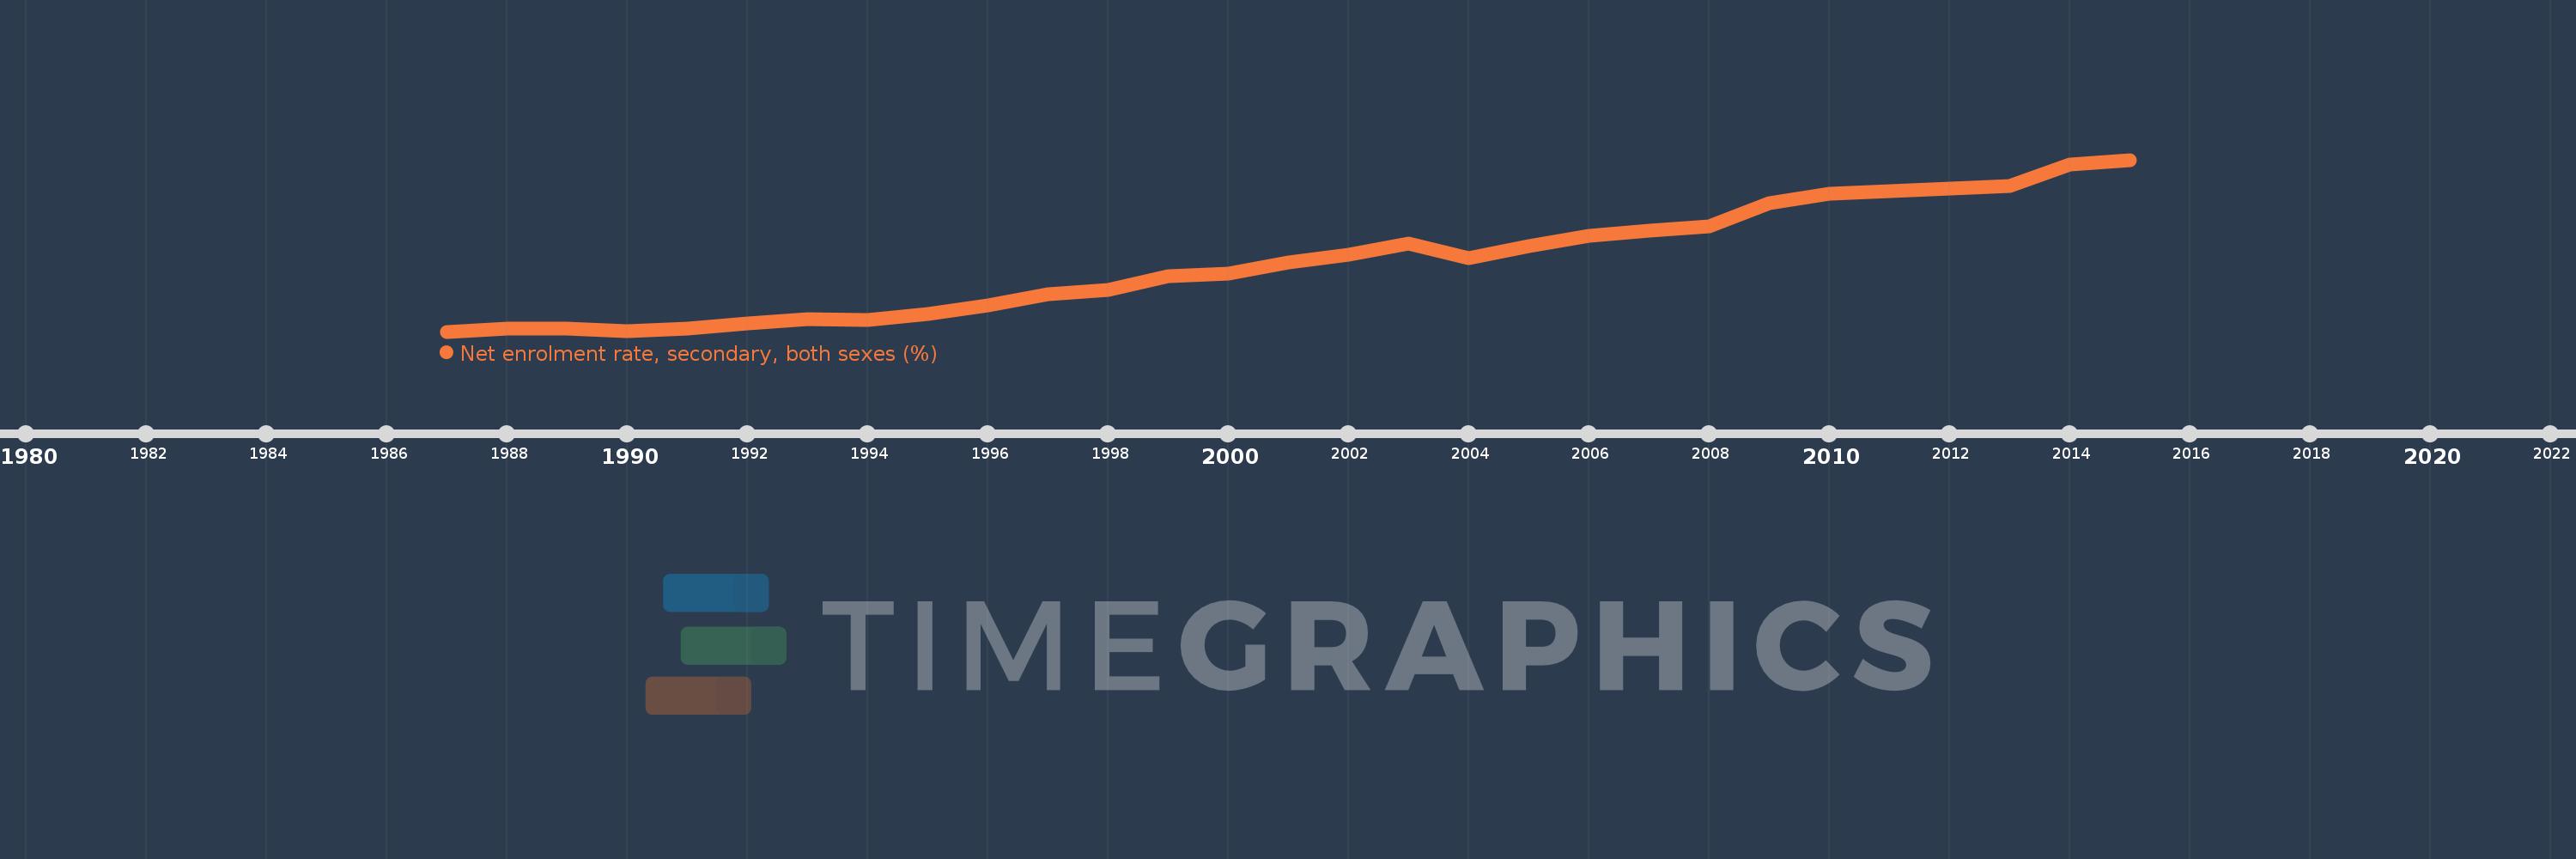
Net enrolment rate, secondary, both sexes (%)
2015,2014,2013,2012,2011,2010,2009,2008,2007,2006,2005,2004,2003,2002,2001,2000,1999,1998,1997,1996,1995,1994,1993,1992,1991,1990,1989,1988,1987
Estas estadísticas en otros países:
AfghanistanAlbaniaAlgeriaAngolaAntigua and BarbudaArab WorldArgentinaArmeniaArubaAustraliaAustriaAzerbaijanBahamas, TheBahrainBangladeshBarbadosBelarusBelgiumBelizeBeninBermudaBhutanBoliviaBotswanaBrazilBritish Virgin IslandsBrunei DarussalamBulgariaBurkina FasoBurundiCabo VerdeCambodiaCameroonCanadaCaribbean small statesCentral African RepublicCentral Europe and the BalticsChadChileColombiaComorosCongo, Dem. Rep.Congo, Rep.Costa RicaCroatiaCubaCyprusDenmarkDjiboutiDominicaDominican RepublicEarly-demographic dividendEast Asia & PacificEast Asia & Pacific (excluding high income)East Asia & Pacific (IDA & IBRD countries)EcuadorEgypt, Arab Rep.El SalvadorEquatorial GuineaEritreaEstoniaEthiopiaEuro areaEurope & Central AsiaEurope & Central Asia (excluding high income)Europe & Central Asia (IDA & IBRD countries)European UnionFijiFinlandFragile and conflict affected situationsFranceGambia, TheGeorgiaGhanaGreeceGrenadaGuatemalaGuineaGuinea-BissauGuyanaHeavily indebted poor countries (HIPC)High incomeHondurasHong Kong SAR, ChinaHungaryIBRD onlyIcelandIDA & IBRD totalIDA blendIDA onlyIDA totalIndiaIndonesiaIran, Islamic Rep.IraqIrelandIsraelItalyJamaicaJapanJordanKazakhstanKenyaKiribatiKorea, Dem. People’s Rep.Korea, Rep.KuwaitKyrgyz RepublicLao PDRLate-demographic dividendLatin America & Caribbean Latin America & Caribbean (excluding high income)Latin America & the Caribbean (IDA & IBRD countries)LatviaLeast developed countries: UN classificationLebanonLesothoLibyaLiechtensteinLithuaniaLow & middle incomeLow incomeLower middle incomeLuxembourgMacao SAR, ChinaMacedonia, FYRMadagascarMalawiMalaysiaMaldivesMaliMaltaMarshall IslandsMauritaniaMauritiusMexicoMiddle East & North AfricaMiddle East & North Africa (excluding high income)Middle East & North Africa (IDA & IBRD countries)Middle incomeMoldovaMongoliaMoroccoMozambiqueMyanmarNamibiaNauruNepalNetherlandsNew ZealandNicaraguaNigerNorth AmericaNorwayOECD membersOmanOther small statesPacific island small statesPakistanPanamaParaguayPeruPhilippinesPolandPortugalPost-demographic dividendPre-demographic dividendPuerto RicoQatarRomaniaSamoaSao Tome and PrincipeSaudi ArabiaSenegalSerbiaSeychellesSierra LeoneSloveniaSmall statesSolomon IslandsSomaliaSouth AfricaSouth AsiaSouth Asia (IDA & IBRD)SpainSri LankaSt. Kitts and NevisSt. LuciaSt. Vincent and the GrenadinesSub-Saharan Africa Sub-Saharan Africa (excluding high income)Sub-Saharan Africa (IDA & IBRD countries)SurinameSwazilandSwedenSwitzerlandSyrian Arab RepublicTajikistanThailandTimor-LesteTogoTongaTrinidad and TobagoTunisiaTurkeyTuvaluUgandaUkraineUnited Arab EmiratesUnited KingdomUnited StatesUpper middle incomeUruguayVanuatuVenezuela, RBVietnamWest Bank and GazaWorldYemen, Rep.Zimbabwe línea de tiempo (timeline):
En esta escala de tiempo se presenta un gráfico de 1987 y 2015 de Latin America & the Caribbean (IDA & IBRD countries). Los datos de 1986 están ausentes. El número de observaciones reales por fecha: 29.
Fuente (nombre):
Indicadores del desarrollo mundial
Fuente (organización):
UNESCO Institute for Statistics
Categorías:
Education
Se ha actualizado:
23 abr 2017 año
Los indicadores de los cambios de valor en los últimos años
Mínimo:
58.183
1 ene 1987 año
Máximo:
75.608
1 ene 2015 año
A la fecha de observación
Valor
Cambio absoluto
El cambio con respecto al valor anterior
1 ene 1987 año
58.183
+58.183
0.0%
1 ene 1988 año
58.464
+0.281
0.48%
1 ene 1989 año
58.516
+0.052
0.09%
1 ene 1990 año
58.217
-0.299
-0.51%
1 ene 1991 año
58.485
+0.268
0.46%
1 ene 1992 año
58.995
+0.51
0.87%
1 ene 1993 año
59.477
+0.482
0.82%
1 ene 1994 año
59.384
-0.093
-0.16%
1 ene 1995 año
59.974
+0.59
0.99%
1 ene 1996 año
60.84
+0.866
1.44%
1 ene 1997 año
61.961
+1.121
1.84%
1 ene 1998 año
62.374
+0.413
0.67%
1 ene 1999 año
63.79
+1.415
2.27%
1 ene 2000 año
64.106
+0.316
0.49%
1 ene 2001 año
65.166
+1.06
1.65%
1 ene 2002 año
66.014
+0.848
1.3%
1 ene 2003 año
67.073
+1.059
1.6%
1 ene 2004 año
65.649
-1.424
-2.12%
1 ene 2005 año
66.861
+1.212
1.85%
1 ene 2006 año
67.889
+1.029
1.54%
1 ene 2007 año
68.427
+0.537
0.79%
1 ene 2008 año
68.816
+0.389
0.57%
1 ene 2009 año
71.165
+2.349
3.41%
1 ene 2010 año
72.125
+0.96
1.35%
1 ene 2011 año
72.456
+0.33
0.46%
1 ene 2012 año
72.659
+0.204
0.28%
1 ene 2013 año
72.976
+0.317
0.44%
1 ene 2014 año
75.086
+2.111
2.89%
1 ene 2015 año
75.608
+0.521
0.69%
Ranking de los países por los datos estadísticos actuales


Comentarios: