29
/es/
es
AIzaSyAYiBZKx7MnpbEhh9jyipgxe19OcubqV5w
April 1, 2024
47674
Lower middle income
LMC
false
2
1
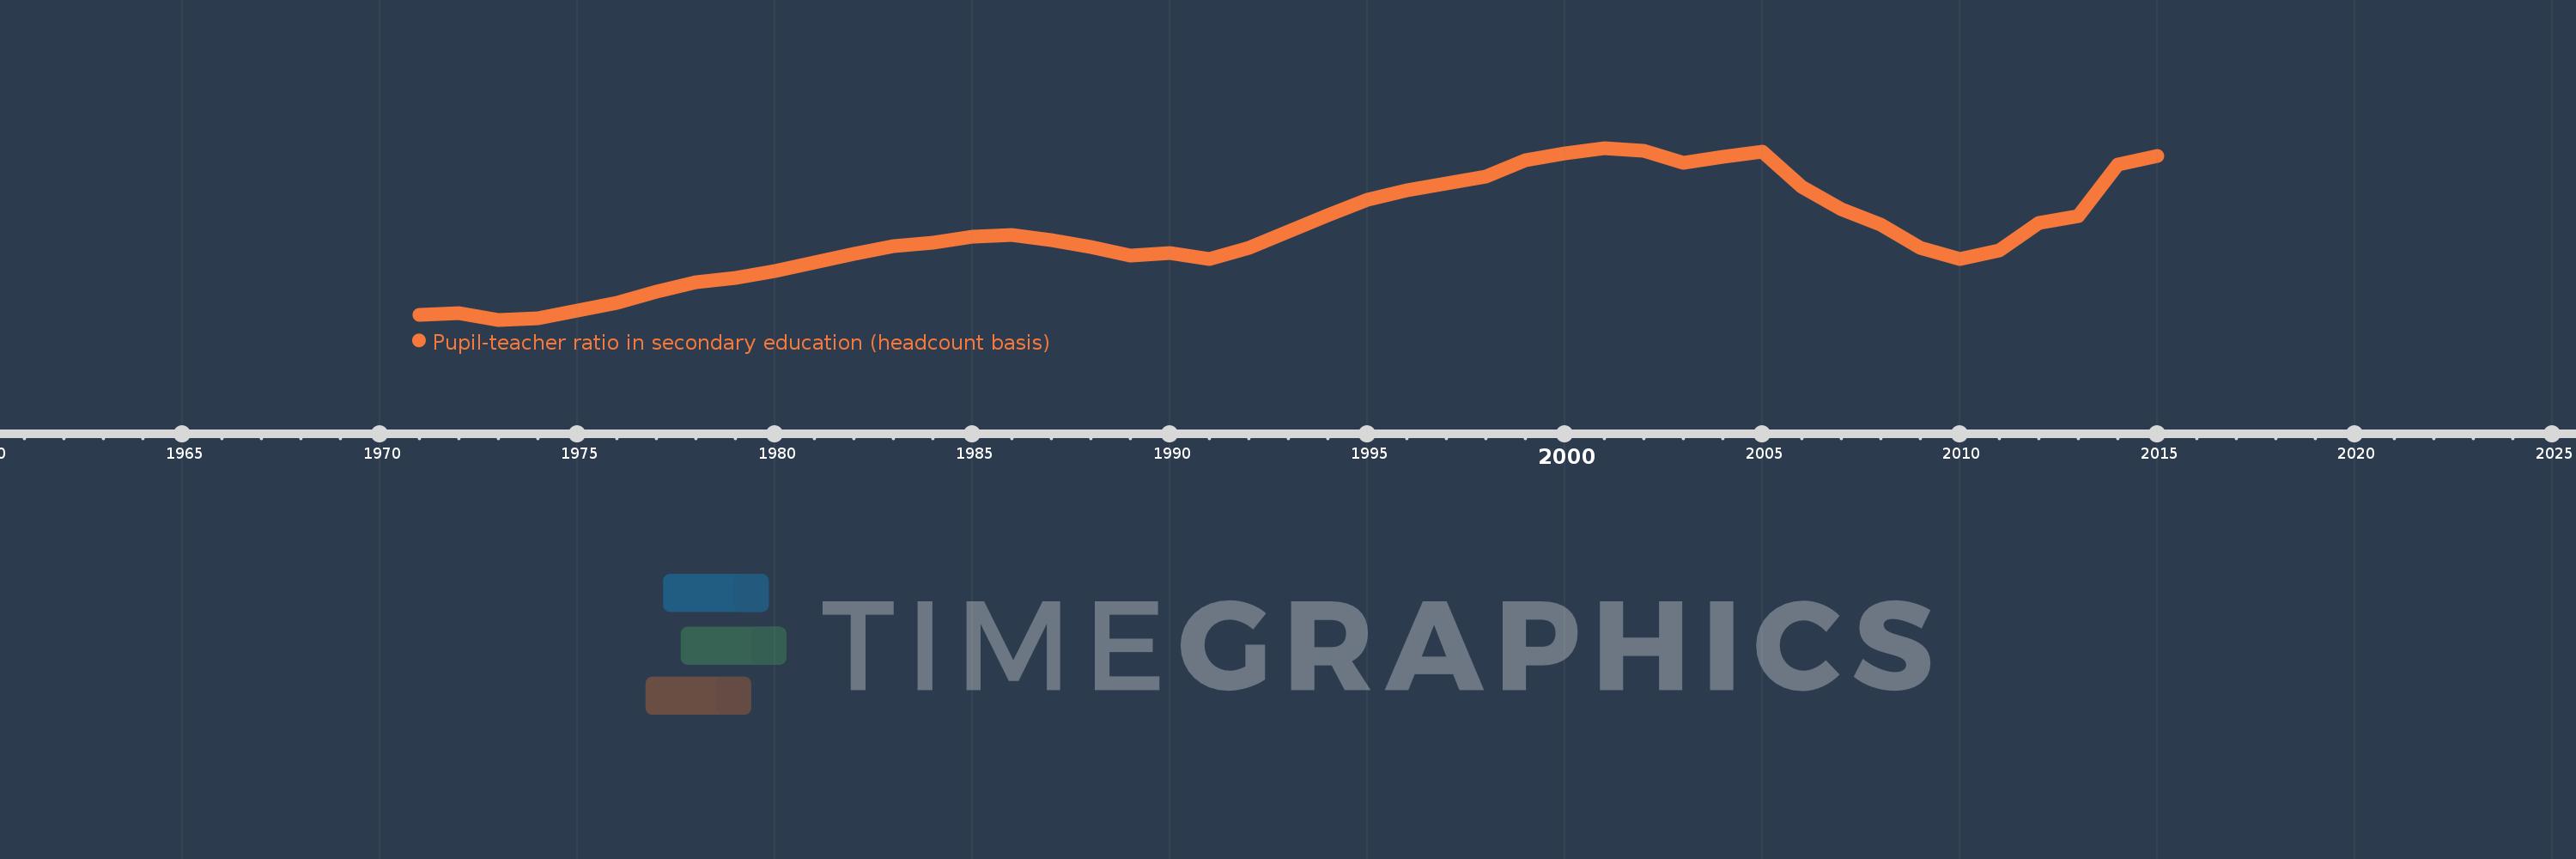
Pupil-teacher ratio in secondary education (headcount basis)
2015,2014,2013,2012,2011,2010,2009,2008,2007,2006,2005,2004,2003,2002,2001,2000,1999,1998,1997,1996,1995,1994,1993,1992,1991,1990,1989,1988,1987,1986,1985,1984,1983,1982,1981,1980,1979,1978,1977,1976,1975,1974,1973,1972,1971
Estas estadísticas en otros países:
AfghanistanAlbaniaAlgeriaAndorraAngolaAntigua and BarbudaArab WorldArgentinaArmeniaArubaAustriaBahamas, TheBahrainBangladeshBarbadosBelarusBelgiumBelizeBeninBermudaBhutanBoliviaBosnia and HerzegovinaBotswanaBrazilBritish Virgin IslandsBrunei DarussalamBulgariaBurkina FasoBurundiCabo VerdeCambodiaCameroonCanadaCaribbean small statesCayman IslandsCentral African RepublicCentral Europe and the BalticsChadChileChinaColombiaComorosCongo, Dem. Rep.Congo, Rep.Costa RicaCote d'IvoireCroatiaCubaCyprusCzech RepublicDenmarkDjiboutiDominicaDominican RepublicEarly-demographic dividendEast Asia & PacificEast Asia & Pacific (excluding high income)East Asia & Pacific (IDA & IBRD countries)EcuadorEgypt, Arab Rep.El SalvadorEquatorial GuineaEritreaEstoniaEthiopiaEuro areaEurope & Central AsiaEurope & Central Asia (excluding high income)Europe & Central Asia (IDA & IBRD countries)European UnionFijiFinlandFragile and conflict affected situationsFranceGabonGambia, TheGeorgiaGermanyGhanaGibraltarGreeceGrenadaGuatemalaGuineaGuinea-BissauGuyanaHaitiHeavily indebted poor countries (HIPC)High incomeHondurasHong Kong SAR, ChinaHungaryIBRD onlyIcelandIDA & IBRD totalIDA blendIDA onlyIDA totalIndiaIndonesiaIran, Islamic Rep.IraqIrelandIsraelItalyJamaicaJapanJordanKazakhstanKenyaKiribatiKorea, Dem. People’s Rep.Korea, Rep.KuwaitKyrgyz RepublicLao PDRLate-demographic dividendLatin America & Caribbean Latin America & Caribbean (excluding high income)Latin America & the Caribbean (IDA & IBRD countries)LatviaLeast developed countries: UN classificationLebanonLesothoLiberiaLibyaLiechtensteinLithuaniaLow & middle incomeLow incomeLower middle incomeLuxembourgMacao SAR, ChinaMacedonia, FYRMadagascarMalawiMalaysiaMaldivesMaliMaltaMarshall IslandsMauritaniaMauritiusMexicoMiddle East & North AfricaMiddle East & North Africa (excluding high income)Middle East & North Africa (IDA & IBRD countries)Middle incomeMoldovaMonacoMongoliaMoroccoMozambiqueMyanmarNamibiaNauruNepalNetherlandsNew ZealandNicaraguaNigerNigeriaNorth AmericaNorwayOECD membersOmanOther small statesPacific island small statesPakistanPalauPanamaPapua New GuineaParaguayPeruPhilippinesPolandPortugalPost-demographic dividendPre-demographic dividendPuerto RicoQatarRomaniaRussian FederationRwandaSamoaSan MarinoSao Tome and PrincipeSaudi ArabiaSenegalSerbiaSeychellesSierra LeoneSingaporeSint Maarten (Dutch part)Slovak RepublicSloveniaSmall statesSolomon IslandsSomaliaSouth AfricaSouth AsiaSouth Asia (IDA & IBRD)SpainSri LankaSt. Kitts and NevisSt. LuciaSt. Vincent and the GrenadinesSub-Saharan Africa Sub-Saharan Africa (excluding high income)Sub-Saharan Africa (IDA & IBRD countries)SudanSurinameSwazilandSwedenSwitzerlandSyrian Arab RepublicTajikistanTanzaniaThailandTimor-LesteTogoTongaTrinidad and TobagoTunisiaTurkeyTurks and Caicos IslandsUgandaUkraineUnited Arab EmiratesUnited KingdomUnited StatesUpper middle incomeUruguayUzbekistanVanuatuVenezuela, RBVietnamWest Bank and GazaWorldYemen, Rep.ZambiaZimbabwe línea de tiempo (timeline):
En esta escala de tiempo se presenta un gráfico de 1971 y 2015 de Lower middle income. Los datos de 1970 están ausentes. El número de observaciones reales por fecha: 45.
Fuente (nombre):
Indicadores del desarrollo mundial
Fuente (organización):
UNESCO Institute for Statistics
Categorías:
Education
Se ha actualizado:
23 abr 2017 año
Los indicadores de los cambios de valor en los últimos años
Mínimo:
19.266
1 ene 1973 año
Máximo:
24.49
1 ene 2001 año
A la fecha de observación
Valor
Cambio absoluto
El cambio con respecto al valor anterior
1 ene 1971 año
19.405
+19.405
0.0%
1 ene 1972 año
19.469
+0.065
0.33%
1 ene 1973 año
19.266
-0.204
-1.05%
1 ene 1974 año
19.316
+0.05
0.26%
1 ene 1975 año
19.54
+0.224
1.16%
1 ene 1976 año
19.791
+0.251
1.28%
1 ene 1977 año
20.126
+0.335
1.69%
1 ene 1978 año
20.414
+0.288
1.43%
1 ene 1979 año
20.538
+0.124
0.61%
1 ene 1980 año
20.735
+0.197
0.96%
1 ene 1981 año
21.013
+0.278
1.34%
1 ene 1982 año
21.258
+0.244
1.16%
1 ene 1983 año
21.51
+0.252
1.19%
1 ene 1984 año
21.613
+0.103
0.48%
1 ene 1985 año
21.779
+0.166
0.77%
1 ene 1986 año
21.839
+0.06
0.28%
1 ene 1987 año
21.7
-0.139
-0.64%
1 ene 1988 año
21.478
-0.223
-1.03%
1 ene 1989 año
21.228
-0.249
-1.16%
1 ene 1990 año
21.297
+0.069
0.33%
1 ene 1991 año
21.11
-0.188
-0.88%
1 ene 1992 año
21.463
+0.353
1.67%
1 ene 1993 año
21.953
+0.491
2.29%
1 ene 1994 año
22.437
+0.484
2.2%
1 ene 1995 año
22.91
+0.473
2.11%
1 ene 1996 año
23.205
+0.294
1.28%
1 ene 1997 año
23.418
+0.213
0.92%
1 ene 1998 año
23.626
+0.208
0.89%
1 ene 1999 año
24.112
+0.486
2.06%
1 ene 2000 año
24.327
+0.215
0.89%
1 ene 2001 año
24.49
+0.163
0.67%
1 ene 2002 año
24.398
-0.092
-0.38%
1 ene 2003 año
24.042
-0.356
-1.46%
1 ene 2004 año
24.214
+0.172
0.71%
1 ene 2005 año
24.387
+0.173
0.71%
1 ene 2006 año
23.315
-1.072
-4.39%
1 ene 2007 año
22.636
-0.679
-2.91%
1 ene 2008 año
22.157
-0.479
-2.12%
1 ene 2009 año
21.458
-0.699
-3.16%
1 ene 2010 año
21.112
-0.346
-1.61%
1 ene 2011 año
21.375
+0.263
1.25%
1 ene 2012 año
22.198
+0.822
3.85%
1 ene 2013 año
22.427
+0.229
1.03%
1 ene 2014 año
23.983
+1.556
6.94%
1 ene 2015 año
24.24
+0.256
1.07%
Ranking de los países por los datos estadísticos actuales


Comentarios: