29
/es/
es
AIzaSyAYiBZKx7MnpbEhh9jyipgxe19OcubqV5w
April 1, 2024
46628
Low income
LIC
false
2
1
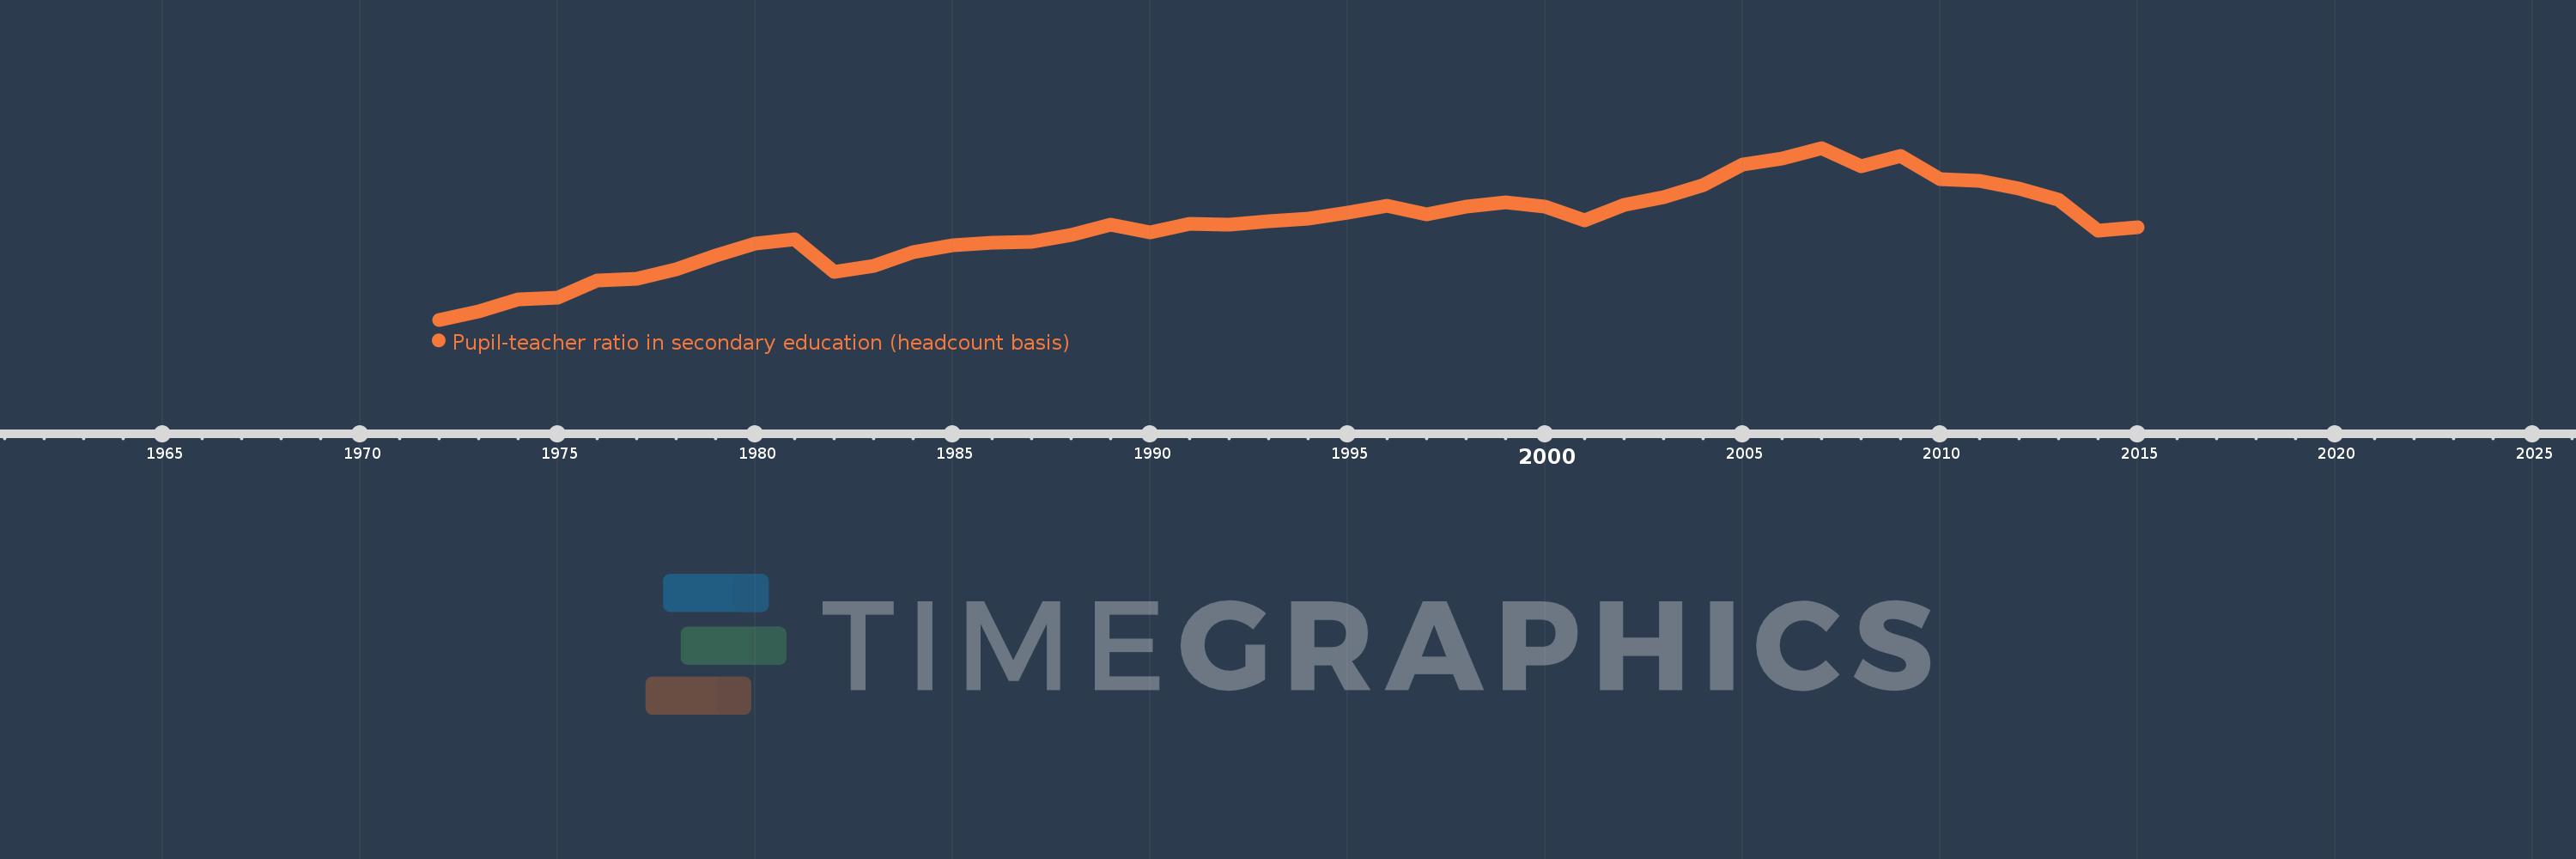
Pupil-teacher ratio in secondary education (headcount basis)
2015,2014,2013,2012,2011,2010,2009,2008,2007,2006,2005,2004,2003,2002,2001,2000,1999,1998,1997,1996,1995,1994,1993,1992,1991,1990,1989,1988,1987,1986,1985,1984,1983,1982,1981,1980,1979,1978,1977,1976,1975,1974,1973,1972
Estas estadísticas en otros países:
AfghanistanAlbaniaAlgeriaAndorraAngolaAntigua and BarbudaArab WorldArgentinaArmeniaArubaAustriaBahamas, TheBahrainBangladeshBarbadosBelarusBelgiumBelizeBeninBermudaBhutanBoliviaBosnia and HerzegovinaBotswanaBrazilBritish Virgin IslandsBrunei DarussalamBulgariaBurkina FasoBurundiCabo VerdeCambodiaCameroonCanadaCaribbean small statesCayman IslandsCentral African RepublicCentral Europe and the BalticsChadChileChinaColombiaComorosCongo, Dem. Rep.Congo, Rep.Costa RicaCote d'IvoireCroatiaCubaCyprusCzech RepublicDenmarkDjiboutiDominicaDominican RepublicEarly-demographic dividendEast Asia & PacificEast Asia & Pacific (excluding high income)East Asia & Pacific (IDA & IBRD countries)EcuadorEgypt, Arab Rep.El SalvadorEquatorial GuineaEritreaEstoniaEthiopiaEuro areaEurope & Central AsiaEurope & Central Asia (excluding high income)Europe & Central Asia (IDA & IBRD countries)European UnionFijiFinlandFragile and conflict affected situationsFranceGabonGambia, TheGeorgiaGermanyGhanaGibraltarGreeceGrenadaGuatemalaGuineaGuinea-BissauGuyanaHaitiHeavily indebted poor countries (HIPC)High incomeHondurasHong Kong SAR, ChinaHungaryIBRD onlyIcelandIDA & IBRD totalIDA blendIDA onlyIDA totalIndiaIndonesiaIran, Islamic Rep.IraqIrelandIsraelItalyJamaicaJapanJordanKazakhstanKenyaKiribatiKorea, Dem. People’s Rep.Korea, Rep.KuwaitKyrgyz RepublicLao PDRLate-demographic dividendLatin America & Caribbean Latin America & Caribbean (excluding high income)Latin America & the Caribbean (IDA & IBRD countries)LatviaLeast developed countries: UN classificationLebanonLesothoLiberiaLibyaLiechtensteinLithuaniaLow & middle incomeLow incomeLower middle incomeLuxembourgMacao SAR, ChinaMacedonia, FYRMadagascarMalawiMalaysiaMaldivesMaliMaltaMarshall IslandsMauritaniaMauritiusMexicoMiddle East & North AfricaMiddle East & North Africa (excluding high income)Middle East & North Africa (IDA & IBRD countries)Middle incomeMoldovaMonacoMongoliaMoroccoMozambiqueMyanmarNamibiaNauruNepalNetherlandsNew ZealandNicaraguaNigerNigeriaNorth AmericaNorwayOECD membersOmanOther small statesPacific island small statesPakistanPalauPanamaPapua New GuineaParaguayPeruPhilippinesPolandPortugalPost-demographic dividendPre-demographic dividendPuerto RicoQatarRomaniaRussian FederationRwandaSamoaSan MarinoSao Tome and PrincipeSaudi ArabiaSenegalSerbiaSeychellesSierra LeoneSingaporeSint Maarten (Dutch part)Slovak RepublicSloveniaSmall statesSolomon IslandsSomaliaSouth AfricaSouth AsiaSouth Asia (IDA & IBRD)SpainSri LankaSt. Kitts and NevisSt. LuciaSt. Vincent and the GrenadinesSub-Saharan Africa Sub-Saharan Africa (excluding high income)Sub-Saharan Africa (IDA & IBRD countries)SudanSurinameSwazilandSwedenSwitzerlandSyrian Arab RepublicTajikistanTanzaniaThailandTimor-LesteTogoTongaTrinidad and TobagoTunisiaTurkeyTurks and Caicos IslandsUgandaUkraineUnited Arab EmiratesUnited KingdomUnited StatesUpper middle incomeUruguayUzbekistanVanuatuVenezuela, RBVietnamWest Bank and GazaWorldYemen, Rep.ZambiaZimbabwe línea de tiempo (timeline):
En esta escala de tiempo se presenta un gráfico de 1972 y 2015 de Low income. Los datos de 1971 están ausentes. El número de observaciones reales por fecha: 44.
Fuente (nombre):
Indicadores del desarrollo mundial
Fuente (organización):
UNESCO Institute for Statistics
Categorías:
Education
Se ha actualizado:
23 abr 2017 año
Los indicadores de los cambios de valor en los últimos años
Mínimo:
21.245
1 ene 1972 año
Máximo:
25.587
1 ene 2007 año
A la fecha de observación
Valor
Cambio absoluto
El cambio con respecto al valor anterior
1 ene 1972 año
21.245
+21.245
0.0%
1 ene 1973 año
21.45
+0.205
0.96%
1 ene 1974 año
21.759
+0.309
1.44%
1 ene 1975 año
21.807
+0.048
0.22%
1 ene 1976 año
22.239
+0.432
1.98%
1 ene 1977 año
22.288
+0.049
0.22%
1 ene 1978 año
22.528
+0.24
1.08%
1 ene 1979 año
22.873
+0.346
1.53%
1 ene 1980 año
23.161
+0.288
1.26%
1 ene 1981 año
23.288
+0.127
0.55%
1 ene 1982 año
22.455
-0.833
-3.58%
1 ene 1983 año
22.614
+0.158
0.71%
1 ene 1984 año
22.961
+0.347
1.54%
1 ene 1985 año
23.138
+0.177
0.77%
1 ene 1986 año
23.191
+0.052
0.23%
1 ene 1987 año
23.222
+0.031
0.14%
1 ene 1988 año
23.397
+0.176
0.76%
1 ene 1989 año
23.638
+0.241
1.03%
1 ene 1990 año
23.456
-0.182
-0.77%
1 ene 1991 año
23.673
+0.217
0.92%
1 ene 1992 año
23.649
-0.024
-0.1%
1 ene 1993 año
23.735
+0.086
0.36%
1 ene 1994 año
23.796
+0.061
0.26%
1 ene 1995 año
23.942
+0.147
0.62%
1 ene 1996 año
24.13
+0.188
0.79%
1 ene 1997 año
23.906
-0.225
-0.93%
1 ene 1998 año
24.107
+0.202
0.84%
1 ene 1999 año
24.206
+0.099
0.41%
1 ene 2000 año
24.102
-0.104
-0.43%
1 ene 2001 año
23.755
-0.347
-1.44%
1 ene 2002 año
24.157
+0.403
1.7%
1 ene 2003 año
24.334
+0.177
0.73%
1 ene 2004 año
24.645
+0.311
1.28%
1 ene 2005 año
25.169
+0.524
2.13%
1 ene 2006 año
25.321
+0.151
0.6%
1 ene 2007 año
25.587
+0.267
1.05%
1 ene 2008 año
25.116
-0.471
-1.84%
1 ene 2009 año
25.384
+0.268
1.07%
1 ene 2010 año
24.806
-0.578
-2.28%
1 ene 2011 año
24.755
-0.05
-0.2%
1 ene 2012 año
24.566
-0.189
-0.77%
1 ene 2013 año
24.286
-0.28
-1.14%
1 ene 2014 año
23.494
-0.792
-3.26%
1 ene 2015 año
23.589
+0.095
0.41%
Ranking de los países por los datos estadísticos actuales


Comentarios: