29
/es/
es
AIzaSyAYiBZKx7MnpbEhh9jyipgxe19OcubqV5w
April 1, 2024
204676
Myanmar
MMR
true
2
1
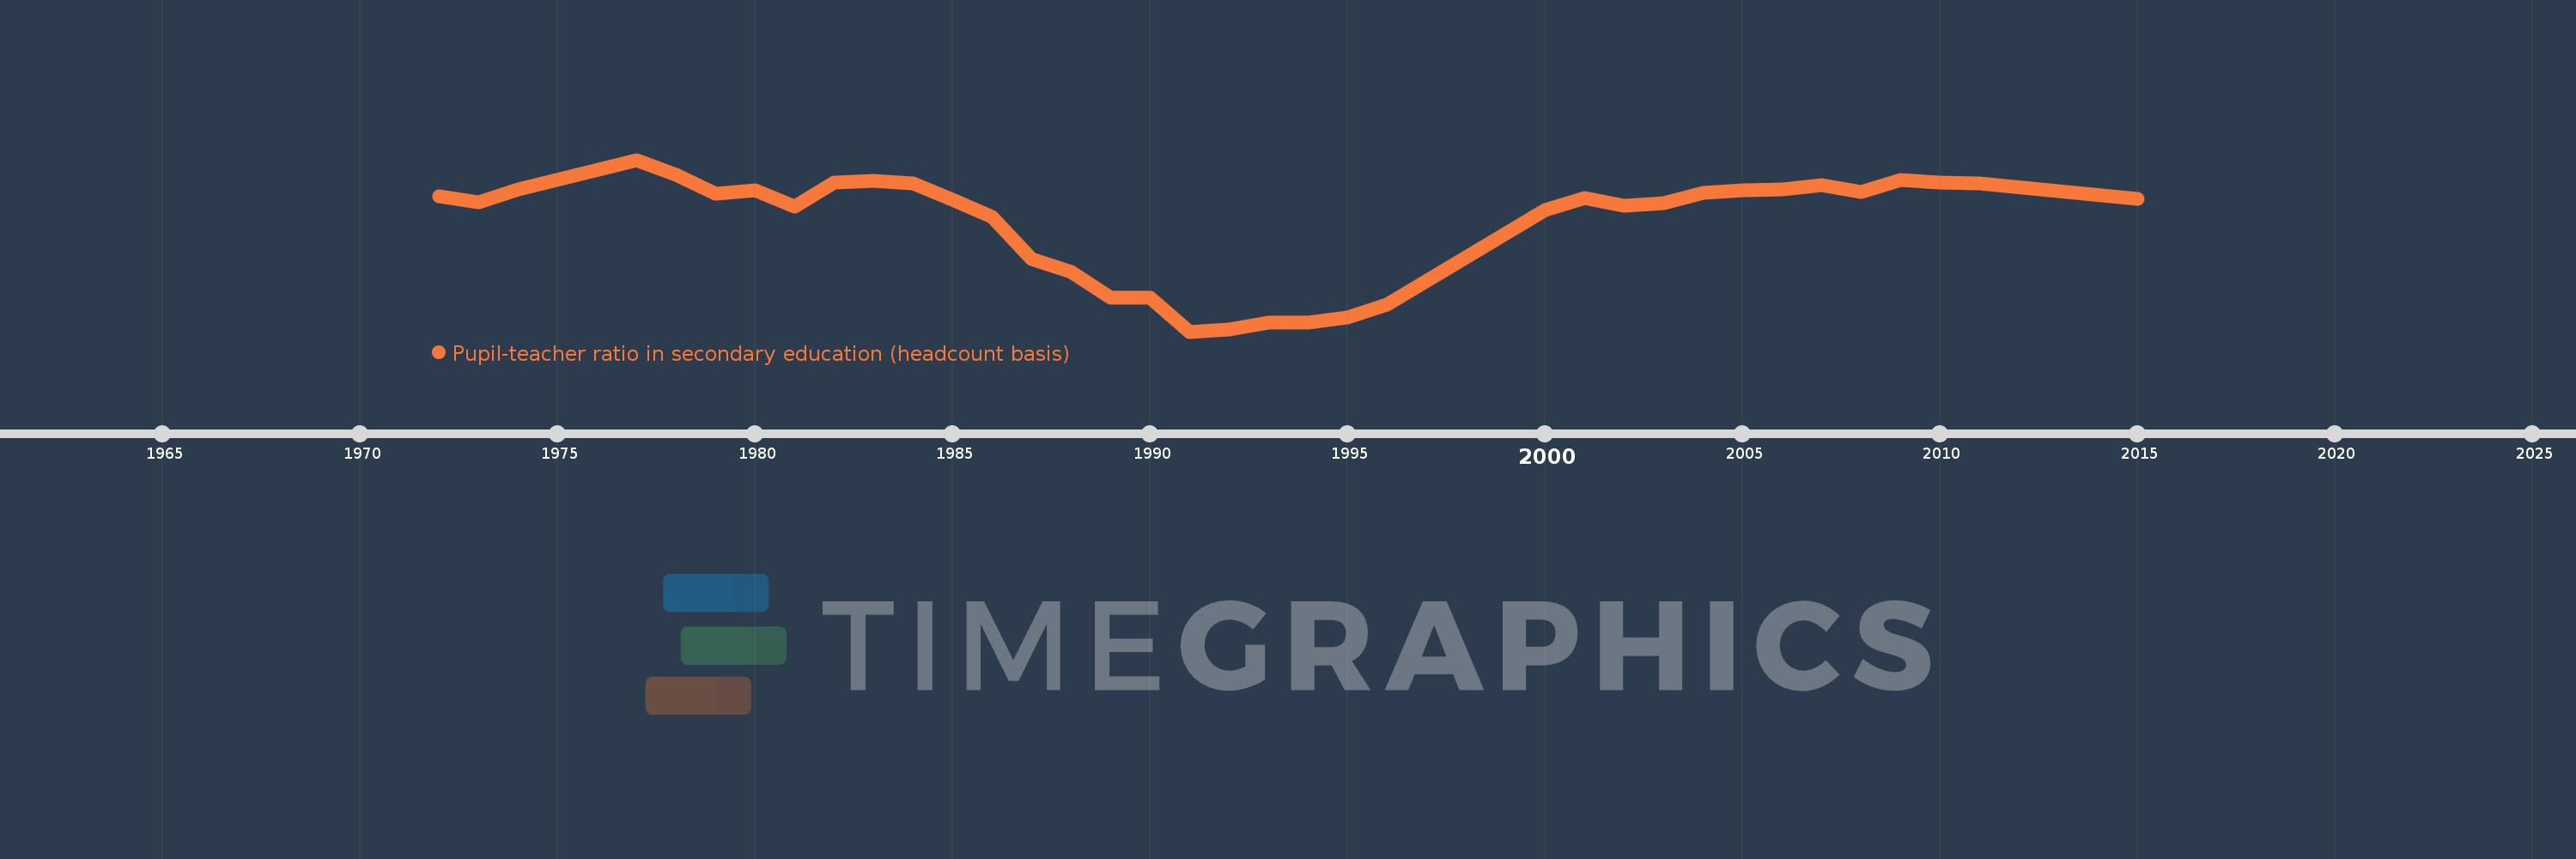
Pupil-teacher ratio in secondary education (headcount basis)
2015,2011,2010,2009,2008,2007,2006,2005,2004,2003,2002,2001,2000,1996,1995,1994,1993,1992,1991,1990,1989,1988,1987,1986,1985,1984,1983,1982,1981,1980,1979,1978,1977,1974,1973,1972
Estas estadísticas en otros países:
AfghanistanAlbaniaAlgeriaAndorraAngolaAntigua and BarbudaArab WorldArgentinaArmeniaArubaAustriaBahamas, TheBahrainBangladeshBarbadosBelarusBelgiumBelizeBeninBermudaBhutanBoliviaBosnia and HerzegovinaBotswanaBrazilBritish Virgin IslandsBrunei DarussalamBulgariaBurkina FasoBurundiCabo VerdeCambodiaCameroonCanadaCaribbean small statesCayman IslandsCentral African RepublicCentral Europe and the BalticsChadChileChinaColombiaComorosCongo, Dem. Rep.Congo, Rep.Costa RicaCote d'IvoireCroatiaCubaCyprusCzech RepublicDenmarkDjiboutiDominicaDominican RepublicEarly-demographic dividendEast Asia & PacificEast Asia & Pacific (excluding high income)East Asia & Pacific (IDA & IBRD countries)EcuadorEgypt, Arab Rep.El SalvadorEquatorial GuineaEritreaEstoniaEthiopiaEuro areaEurope & Central AsiaEurope & Central Asia (excluding high income)Europe & Central Asia (IDA & IBRD countries)European UnionFijiFinlandFragile and conflict affected situationsFranceGabonGambia, TheGeorgiaGermanyGhanaGibraltarGreeceGrenadaGuatemalaGuineaGuinea-BissauGuyanaHaitiHeavily indebted poor countries (HIPC)High incomeHondurasHong Kong SAR, ChinaHungaryIBRD onlyIcelandIDA & IBRD totalIDA blendIDA onlyIDA totalIndiaIndonesiaIran, Islamic Rep.IraqIrelandIsraelItalyJamaicaJapanJordanKazakhstanKenyaKiribatiKorea, Dem. People’s Rep.Korea, Rep.KuwaitKyrgyz RepublicLao PDRLate-demographic dividendLatin America & Caribbean Latin America & Caribbean (excluding high income)Latin America & the Caribbean (IDA & IBRD countries)LatviaLeast developed countries: UN classificationLebanonLesothoLiberiaLibyaLiechtensteinLithuaniaLow & middle incomeLow incomeLower middle incomeLuxembourgMacao SAR, ChinaMacedonia, FYRMadagascarMalawiMalaysiaMaldivesMaliMaltaMarshall IslandsMauritaniaMauritiusMexicoMiddle East & North AfricaMiddle East & North Africa (excluding high income)Middle East & North Africa (IDA & IBRD countries)Middle incomeMoldovaMonacoMongoliaMoroccoMozambiqueMyanmarNamibiaNauruNepalNetherlandsNew ZealandNicaraguaNigerNigeriaNorth AmericaNorwayOECD membersOmanOther small statesPacific island small statesPakistanPalauPanamaPapua New GuineaParaguayPeruPhilippinesPolandPortugalPost-demographic dividendPre-demographic dividendPuerto RicoQatarRomaniaRussian FederationRwandaSamoaSan MarinoSao Tome and PrincipeSaudi ArabiaSenegalSerbiaSeychellesSierra LeoneSingaporeSint Maarten (Dutch part)Slovak RepublicSloveniaSmall statesSolomon IslandsSomaliaSouth AfricaSouth AsiaSouth Asia (IDA & IBRD)SpainSri LankaSt. Kitts and NevisSt. LuciaSt. Vincent and the GrenadinesSub-Saharan Africa Sub-Saharan Africa (excluding high income)Sub-Saharan Africa (IDA & IBRD countries)SudanSurinameSwazilandSwedenSwitzerlandSyrian Arab RepublicTajikistanTanzaniaThailandTimor-LesteTogoTongaTrinidad and TobagoTunisiaTurkeyTurks and Caicos IslandsUgandaUkraineUnited Arab EmiratesUnited KingdomUnited StatesUpper middle incomeUruguayUzbekistanVanuatuVenezuela, RBVietnamWest Bank and GazaWorldYemen, Rep.ZambiaZimbabwe línea de tiempo (timeline):
En esta escala de tiempo se presenta un gráfico de 1972 y 2015 de Myanmar. Los datos de 1971 están ausentes. El número de observaciones reales por fecha: 36.
Fuente (nombre):
Indicadores del desarrollo mundial
Fuente (organización):
UNESCO Institute for Statistics
Categorías:
Education
Se ha actualizado:
23 abr 2017 año
Los indicadores de los cambios de valor en los últimos años
Mínimo:
12.492
1 ene 1991 año
Máximo:
37.473
1 ene 1977 año
A la fecha de observación
Valor
Cambio absoluto
El cambio con respecto al valor anterior
1 ene 1972 año
32.11
+32.11
0.0%
1 ene 1973 año
31.268
-0.842
-2.62%
1 ene 1974 año
33.111
+1.843
5.89%
1 ene 1977 año
37.473
+4.362
13.17%
1 ene 1978 año
35.28
-2.193
-5.85%
1 ene 1979 año
32.51
-2.77
-7.85%
1 ene 1980 año
33.014
+0.504
1.55%
1 ene 1981 año
30.718
-2.296
-6.95%
1 ene 1982 año
34.124
+3.405
11.09%
1 ene 1983 año
34.425
+0.301
0.88%
1 ene 1984 año
34.047
-0.378
-1.1%
1 ene 1985 año
31.671
-2.376
-6.98%
1 ene 1986 año
29.225
-2.447
-7.73%
1 ene 1987 año
22.995
-6.23
-21.32%
1 ene 1988 año
21.161
-1.834
-7.98%
1 ene 1989 año
17.482
-3.678
-17.38%
1 ene 1990 año
17.443
-0.04
-0.23%
1 ene 1991 año
12.492
-4.95
-28.38%
1 ene 1992 año
12.816
+0.324
2.59%
1 ene 1993 año
13.821
+1.005
7.84%
1 ene 1994 año
13.79
-0.031
-0.22%
1 ene 1995 año
14.611
+0.821
5.95%
1 ene 1996 año
16.453
+1.842
12.61%
1 ene 2000 año
30.121
+13.668
83.07%
1 ene 2001 año
31.88
+1.759
5.84%
1 ene 2002 año
30.817
-1.063
-3.33%
1 ene 2003 año
31.157
+0.34
1.1%
1 ene 2004 año
32.611
+1.454
4.67%
1 ene 2005 año
33.043
+0.432
1.33%
1 ene 2006 año
33.135
+0.092
0.28%
1 ene 2007 año
33.773
+0.638
1.92%
1 ene 2008 año
32.781
-0.991
-2.94%
1 ene 2009 año
34.498
+1.717
5.24%
1 ene 2010 año
34.218
-0.28
-0.81%
1 ene 2011 año
34.078
-0.14
-0.41%
1 ene 2015 año
31.803
-2.276
-6.68%
Ranking de los países por los datos estadísticos actuales


Comentarios: