29
/es/
es
AIzaSyAYiBZKx7MnpbEhh9jyipgxe19OcubqV5w
April 1, 2024
47242
Lower middle income
LMC
false
2
1
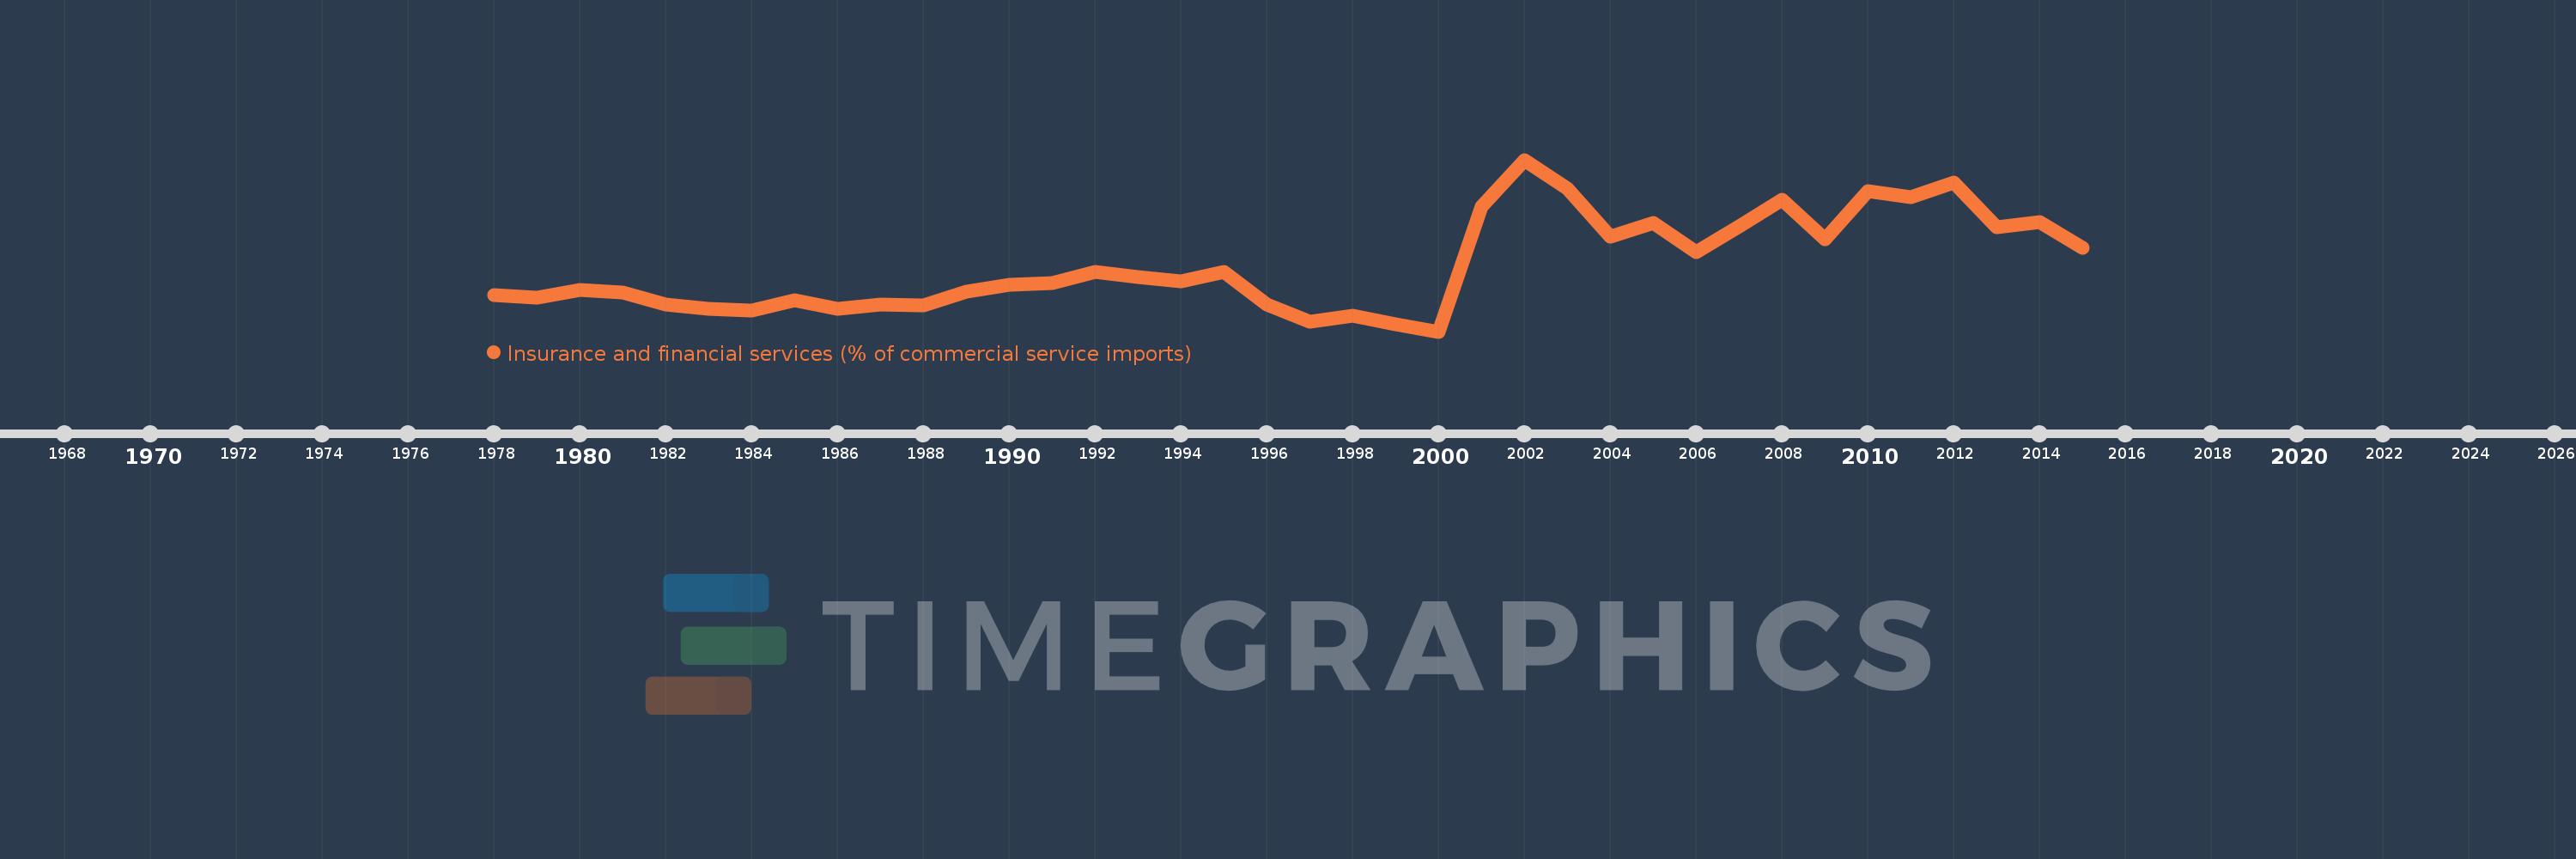
Insurance and financial services (% of commercial service imports)
2015,2014,2013,2012,2011,2010,2009,2008,2007,2006,2005,2004,2003,2002,2001,2000,1999,1998,1997,1996,1995,1994,1993,1992,1991,1990,1989,1988,1987,1986,1985,1984,1983,1982,1981,1980,1979,1978
Estas estadísticas en otros países:
AfghanistanAlbaniaAlgeriaAngolaAntigua and BarbudaArab WorldArgentinaArmeniaArubaAustraliaAustriaAzerbaijanBahamas, TheBahrainBangladeshBarbadosBelarusBelgiumBelizeBeninBermudaBhutanBoliviaBosnia and HerzegovinaBotswanaBrazilBrunei DarussalamBulgariaBurkina FasoBurundiCabo VerdeCambodiaCameroonCanadaCaribbean small statesCentral African RepublicCentral Europe and the BalticsChadChileChinaColombiaComorosCongo, Dem. Rep.Congo, Rep.Costa RicaCote d'IvoireCroatiaCuracaoCyprusCzech RepublicDenmarkDjiboutiDominicaDominican RepublicEarly-demographic dividendEast Asia & PacificEast Asia & Pacific (excluding high income)East Asia & Pacific (IDA & IBRD countries)EcuadorEgypt, Arab Rep.El SalvadorEquatorial GuineaEritreaEstoniaEthiopiaEuro areaEurope & Central AsiaEurope & Central Asia (excluding high income)Europe & Central Asia (IDA & IBRD countries)European UnionFaroe IslandsFijiFinlandFragile and conflict affected situationsFranceFrench PolynesiaGabonGambia, TheGeorgiaGermanyGhanaGreeceGrenadaGuatemalaGuineaGuinea-BissauGuyanaHaitiHeavily indebted poor countries (HIPC)High incomeHondurasHong Kong SAR, ChinaHungaryIBRD onlyIcelandIDA & IBRD totalIDA onlyIDA totalIndiaIndonesiaIran, Islamic Rep.IraqIrelandIsraelItalyJamaicaJapanJordanKazakhstanKenyaKiribatiKorea, Rep.KosovoKuwaitKyrgyz RepublicLao PDRLate-demographic dividendLatin America & Caribbean Latin America & Caribbean (excluding high income)Latin America & the Caribbean (IDA & IBRD countries)LatviaLeast developed countries: UN classificationLebanonLesothoLiberiaLibyaLithuaniaLow & middle incomeLow incomeLower middle incomeLuxembourgMacao SAR, ChinaMacedonia, FYRMadagascarMalawiMalaysiaMaldivesMaliMaltaMarshall IslandsMauritaniaMauritiusMexicoMicronesia, Fed. Sts.Middle East & North AfricaMiddle East & North Africa (excluding high income)Middle East & North Africa (IDA & IBRD countries)Middle incomeMoldovaMongoliaMontenegroMoroccoMozambiqueMyanmarNamibiaNepalNetherlandsNew CaledoniaNew ZealandNicaraguaNigerNigeriaNorth AmericaNorwayOECD membersOmanOther small statesPacific island small statesPakistanPalauPanamaPapua New GuineaParaguayPeruPhilippinesPolandPortugalPost-demographic dividendPre-demographic dividendQatarRomaniaRussian FederationRwandaSamoaSao Tome and PrincipeSaudi ArabiaSenegalSerbiaSeychellesSierra LeoneSingaporeSint Maarten (Dutch part)Slovak RepublicSloveniaSmall statesSolomon IslandsSouth AfricaSouth AsiaSouth Asia (IDA & IBRD)South SudanSpainSri LankaSt. Kitts and NevisSt. LuciaSt. Vincent and the GrenadinesSub-Saharan Africa Sub-Saharan Africa (excluding high income)Sub-Saharan Africa (IDA & IBRD countries)SudanSurinameSwazilandSwedenSwitzerlandSyrian Arab RepublicTajikistanTanzaniaThailandTimor-LesteTogoTongaTrinidad and TobagoTunisiaTurkeyTuvaluUgandaUkraineUnited KingdomUnited StatesUpper middle incomeUruguayVanuatuVenezuela, RBWest Bank and GazaWorldYemen, Rep.ZambiaZimbabwe línea de tiempo (timeline):
En esta escala de tiempo se presenta un gráfico de 1978 y 2015 de Lower middle income. Los datos de 1977 están ausentes. El número de observaciones reales por fecha: 38.
Fuente (nombre):
Indicadores del desarrollo mundial
Fuente (organización):
International Monetary Fund, Balance of Payments Statistics Yearbook and data files.
Categorías:
Private Sector, Trade
Se ha actualizado:
23 abr 2017 año
Los indicadores de los cambios de valor en los últimos años
Mínimo:
4.176
1 ene 2000 año
Máximo:
7.975
1 ene 2002 año
A la fecha de observación
Valor
Cambio absoluto
El cambio con respecto al valor anterior
1 ene 1978 año
4.977
+4.977
0.0%
1 ene 1979 año
4.928
-0.05
-1.0%
1 ene 1980 año
5.099
+0.171
3.48%
1 ene 1981 año
5.039
-0.06
-1.18%
1 ene 1982 año
4.776
-0.263
-5.22%
1 ene 1983 año
4.671
-0.105
-2.2%
1 ene 1984 año
4.65
-0.02
-0.43%
1 ene 1985 año
4.872
+0.222
4.77%
1 ene 1986 año
4.673
-0.199
-4.09%
1 ene 1987 año
4.769
+0.096
2.06%
1 ene 1988 año
4.75
-0.02
-0.41%
1 ene 1989 año
5.068
+0.318
6.7%
1 ene 1990 año
5.22
+0.152
3.0%
1 ene 1991 año
5.24
+0.02
0.38%
1 ene 1992 año
5.488
+0.249
4.74%
1 ene 1993 año
5.374
-0.114
-2.08%
1 ene 1994 año
5.283
-0.091
-1.69%
1 ene 1995 año
5.496
+0.213
4.03%
1 ene 1996 año
4.771
-0.725
-13.19%
1 ene 1997 año
4.4
-0.371
-7.78%
1 ene 1998 año
4.523
+0.123
2.79%
1 ene 1999 año
4.328
-0.194
-4.3%
1 ene 2000 año
4.176
-0.153
-3.53%
1 ene 2001 año
6.934
+2.758
66.06%
1 ene 2002 año
7.975
+1.042
15.02%
1 ene 2003 año
7.348
-0.628
-7.87%
1 ene 2004 año
6.276
-1.072
-14.58%
1 ene 2005 año
6.577
+0.301
4.8%
1 ene 2006 año
5.938
-0.639
-9.72%
1 ene 2007 año
6.499
+0.561
9.45%
1 ene 2008 año
7.096
+0.596
9.18%
1 ene 2009 año
6.213
-0.882
-12.44%
1 ene 2010 año
7.279
+1.066
17.15%
1 ene 2011 año
7.145
-0.134
-1.84%
1 ene 2012 año
7.479
+0.334
4.67%
1 ene 2013 año
6.492
-0.987
-13.2%
1 ene 2014 año
6.589
+0.098
1.5%
1 ene 2015 año
6.029
-0.56
-8.5%
Ranking de los países por los datos estadísticos actuales


Comentarios: