29
/es/
es
AIzaSyAYiBZKx7MnpbEhh9jyipgxe19OcubqV5w
April 1, 2024
245751
South Africa
ZAF
true
2
1
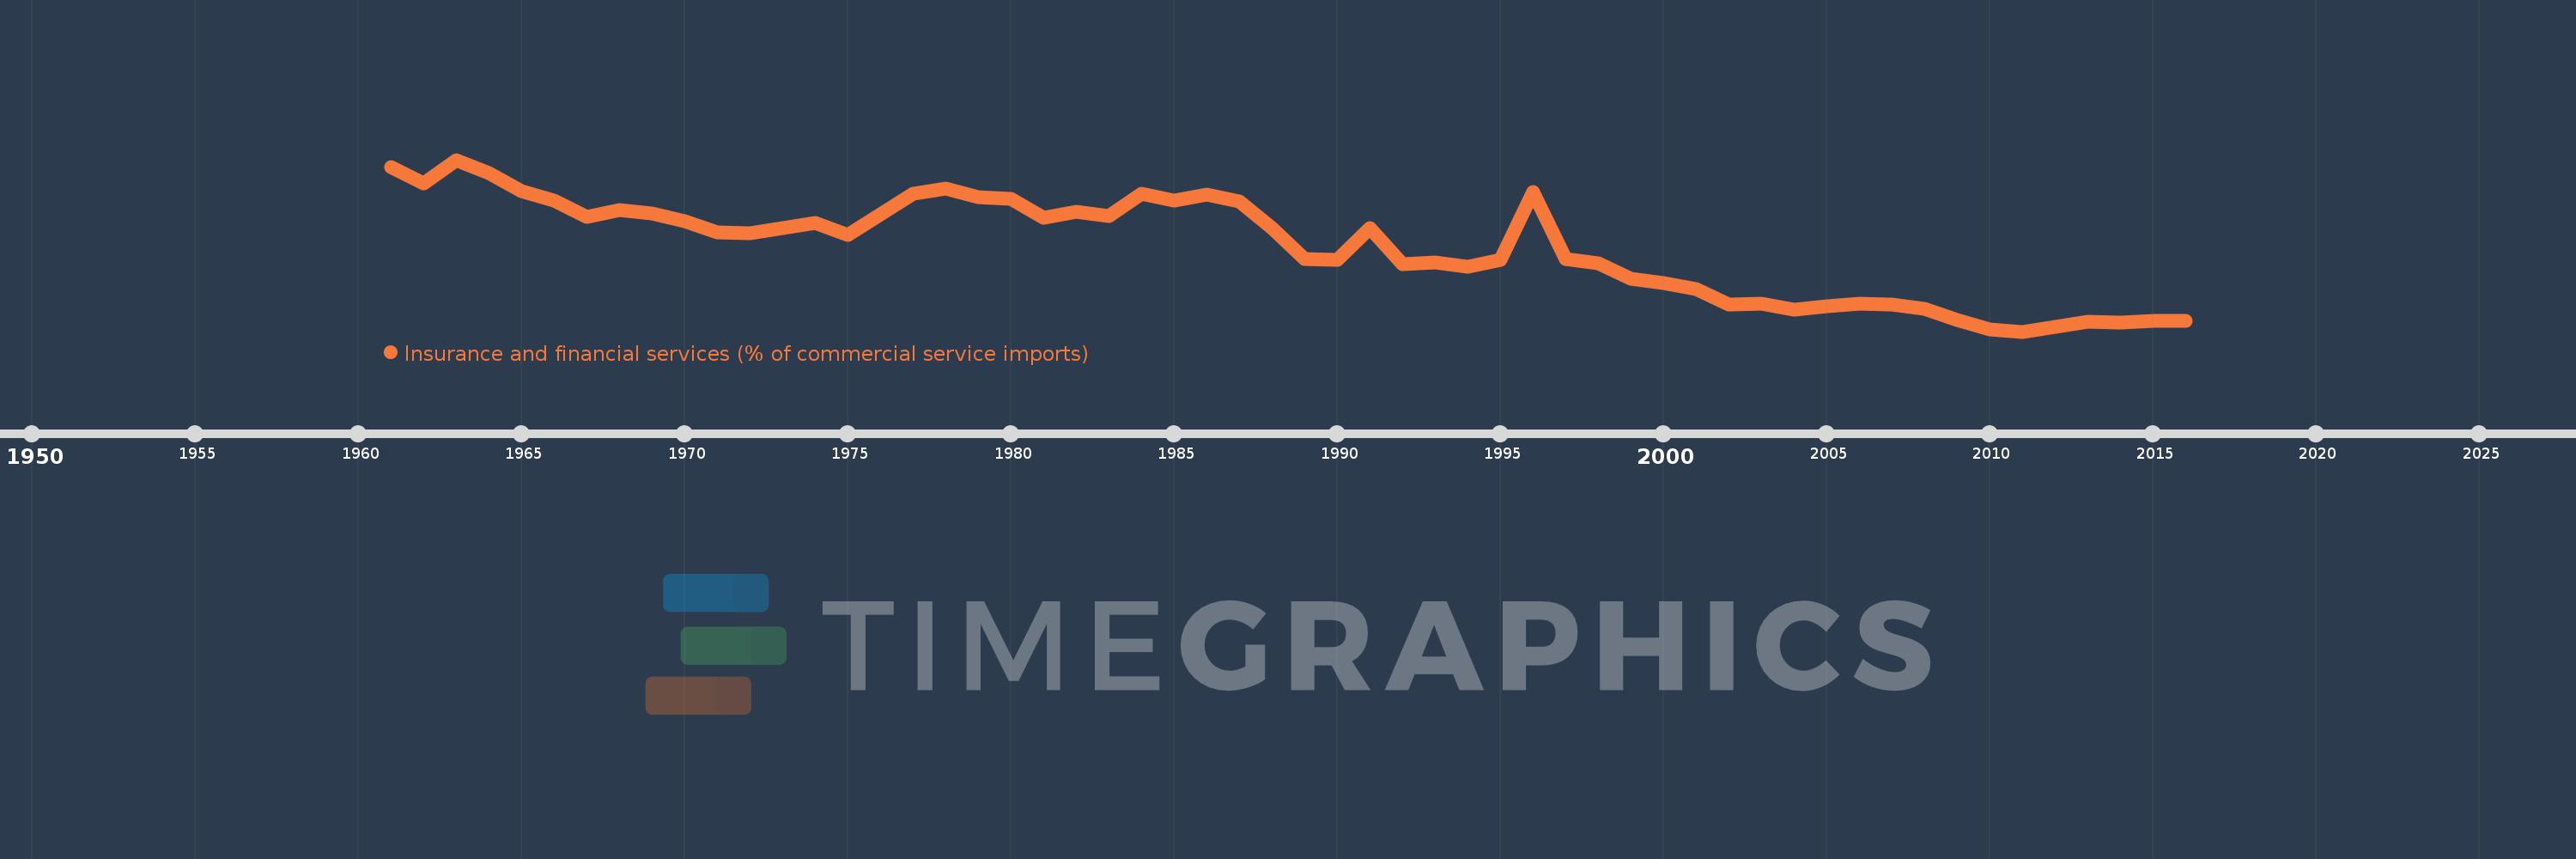
Insurance and financial services (% of commercial service imports)
2016,2015,2014,2013,2012,2011,2010,2009,2008,2007,2006,2005,2004,2003,2002,2001,2000,1999,1998,1997,1996,1995,1994,1993,1992,1991,1990,1989,1988,1987,1986,1985,1984,1983,1982,1981,1980,1979,1978,1977,1976,1975,1974,1973,1972,1971,1970,1969,1968,1967,1966,1965,1964,1963,1962,1961
Estas estadísticas en otros países:
AfghanistanAlbaniaAlgeriaAngolaAntigua and BarbudaArab WorldArgentinaArmeniaArubaAustraliaAustriaAzerbaijanBahamas, TheBahrainBangladeshBarbadosBelarusBelgiumBelizeBeninBermudaBhutanBoliviaBosnia and HerzegovinaBotswanaBrazilBrunei DarussalamBulgariaBurkina FasoBurundiCabo VerdeCambodiaCameroonCanadaCaribbean small statesCentral African RepublicCentral Europe and the BalticsChadChileChinaColombiaComorosCongo, Dem. Rep.Congo, Rep.Costa RicaCote d'IvoireCroatiaCuracaoCyprusCzech RepublicDenmarkDjiboutiDominicaDominican RepublicEarly-demographic dividendEast Asia & PacificEast Asia & Pacific (excluding high income)East Asia & Pacific (IDA & IBRD countries)EcuadorEgypt, Arab Rep.El SalvadorEquatorial GuineaEritreaEstoniaEthiopiaEuro areaEurope & Central AsiaEurope & Central Asia (excluding high income)Europe & Central Asia (IDA & IBRD countries)European UnionFaroe IslandsFijiFinlandFragile and conflict affected situationsFranceFrench PolynesiaGabonGambia, TheGeorgiaGermanyGhanaGreeceGrenadaGuatemalaGuineaGuinea-BissauGuyanaHaitiHeavily indebted poor countries (HIPC)High incomeHondurasHong Kong SAR, ChinaHungaryIBRD onlyIcelandIDA & IBRD totalIDA onlyIDA totalIndiaIndonesiaIran, Islamic Rep.IraqIrelandIsraelItalyJamaicaJapanJordanKazakhstanKenyaKiribatiKorea, Rep.KosovoKuwaitKyrgyz RepublicLao PDRLate-demographic dividendLatin America & Caribbean Latin America & Caribbean (excluding high income)Latin America & the Caribbean (IDA & IBRD countries)LatviaLeast developed countries: UN classificationLebanonLesothoLiberiaLibyaLithuaniaLow & middle incomeLow incomeLower middle incomeLuxembourgMacao SAR, ChinaMacedonia, FYRMadagascarMalawiMalaysiaMaldivesMaliMaltaMarshall IslandsMauritaniaMauritiusMexicoMicronesia, Fed. Sts.Middle East & North AfricaMiddle East & North Africa (excluding high income)Middle East & North Africa (IDA & IBRD countries)Middle incomeMoldovaMongoliaMontenegroMoroccoMozambiqueMyanmarNamibiaNepalNetherlandsNew CaledoniaNew ZealandNicaraguaNigerNigeriaNorth AmericaNorwayOECD membersOmanOther small statesPacific island small statesPakistanPalauPanamaPapua New GuineaParaguayPeruPhilippinesPolandPortugalPost-demographic dividendPre-demographic dividendQatarRomaniaRussian FederationRwandaSamoaSao Tome and PrincipeSaudi ArabiaSenegalSerbiaSeychellesSierra LeoneSingaporeSint Maarten (Dutch part)Slovak RepublicSloveniaSmall statesSolomon IslandsSouth AfricaSouth AsiaSouth Asia (IDA & IBRD)South SudanSpainSri LankaSt. Kitts and NevisSt. LuciaSt. Vincent and the GrenadinesSub-Saharan Africa Sub-Saharan Africa (excluding high income)Sub-Saharan Africa (IDA & IBRD countries)SudanSurinameSwazilandSwedenSwitzerlandSyrian Arab RepublicTajikistanTanzaniaThailandTimor-LesteTogoTongaTrinidad and TobagoTunisiaTurkeyTuvaluUgandaUkraineUnited KingdomUnited StatesUpper middle incomeUruguayVanuatuVenezuela, RBWest Bank and GazaWorldYemen, Rep.ZambiaZimbabwe línea de tiempo (timeline):
En esta escala de tiempo se presenta un gráfico de 1961 y 2016 de South Africa. Los datos de 1960 están ausentes. El número de observaciones reales por fecha: 56.
Fuente (nombre):
Indicadores del desarrollo mundial
Fuente (organización):
International Monetary Fund, Balance of Payments Statistics Yearbook and data files.
Categorías:
Private Sector, Trade
Se ha actualizado:
23 abr 2017 año
Los indicadores de los cambios de valor en los últimos años
Mínimo:
3.433
1 ene 2011 año
Máximo:
16.578
1 ene 1963 año
A la fecha de observación
Valor
Cambio absoluto
El cambio con respecto al valor anterior
1 ene 1961 año
16.0
+16.0
0.0%
1 ene 1962 año
14.793
-1.207
-7.54%
1 ene 1963 año
16.578
+1.785
12.06%
1 ene 1964 año
15.546
-1.031
-6.22%
1 ene 1965 año
14.179
-1.367
-8.79%
1 ene 1966 año
13.48
-0.699
-4.93%
1 ene 1967 año
12.239
-1.241
-9.21%
1 ene 1968 año
12.732
+0.493
4.03%
1 ene 1969 año
12.469
-0.263
-2.07%
1 ene 1970 año
11.879
-0.59
-4.73%
1 ene 1971 año
11.014
-0.865
-7.28%
1 ene 1972 año
10.98
-0.034
-0.31%
1 ene 1973 año
11.328
+0.348
3.17%
1 ene 1974 año
11.76
+0.432
3.81%
1 ene 1975 año
10.838
-0.921
-7.84%
1 ene 1976 año
12.394
+1.555
14.35%
1 ene 1977 año
13.957
+1.563
12.61%
1 ene 1978 año
14.36
+0.403
2.89%
1 ene 1979 año
13.727
-0.633
-4.41%
1 ene 1980 año
13.579
-0.148
-1.08%
1 ene 1981 año
12.145
-1.434
-10.56%
1 ene 1982 año
12.585
+0.44
3.62%
1 ene 1983 año
12.246
-0.339
-2.69%
1 ene 1984 año
13.98
+1.734
14.16%
1 ene 1985 año
13.44
-0.54
-3.86%
1 ene 1986 año
13.916
+0.476
3.54%
1 ene 1987 año
13.381
-0.535
-3.84%
1 ene 1988 año
11.351
-2.029
-15.17%
1 ene 1989 año
8.995
-2.357
-20.76%
1 ene 1990 año
8.9
-0.095
-1.05%
1 ene 1991 año
11.37
+2.47
27.75%
1 ene 1992 año
8.618
-2.752
-24.2%
1 ene 1993 año
8.72
+0.102
1.18%
1 ene 1994 año
8.367
-0.352
-4.04%
1 ene 1995 año
8.92
+0.552
6.6%
1 ene 1996 año
14.105
+5.186
58.14%
1 ene 1997 año
8.99
-5.115
-36.26%
1 ene 1998 año
8.672
-0.318
-3.53%
1 ene 1999 año
7.476
-1.196
-13.79%
1 ene 2000 año
7.114
-0.362
-4.84%
1 ene 2001 año
6.692
-0.422
-5.94%
1 ene 2002 año
5.476
-1.216
-18.16%
1 ene 2003 año
5.577
+0.1
1.83%
1 ene 2004 año
5.09
-0.486
-8.72%
1 ene 2005 año
5.367
+0.277
5.43%
1 ene 2006 año
5.583
+0.216
4.03%
1 ene 2007 año
5.536
-0.047
-0.83%
1 ene 2008 año
5.192
-0.344
-6.22%
1 ene 2009 año
4.294
-0.898
-17.3%
1 ene 2010 año
3.608
-0.686
-15.99%
1 ene 2011 año
3.433
-0.175
-4.85%
1 ene 2012 año
3.795
+0.363
10.56%
1 ene 2013 año
4.187
+0.392
10.32%
1 ene 2014 año
4.127
-0.06
-1.44%
1 ene 2015 año
4.272
+0.145
3.53%
1 ene 2016 año
4.241
-0.031
-0.72%
Ranking de los países por los datos estadísticos actuales


Comentarios: