29
/es/
es
AIzaSyAYiBZKx7MnpbEhh9jyipgxe19OcubqV5w
April 1, 2024
272404
Uganda
UGA
true
2
1
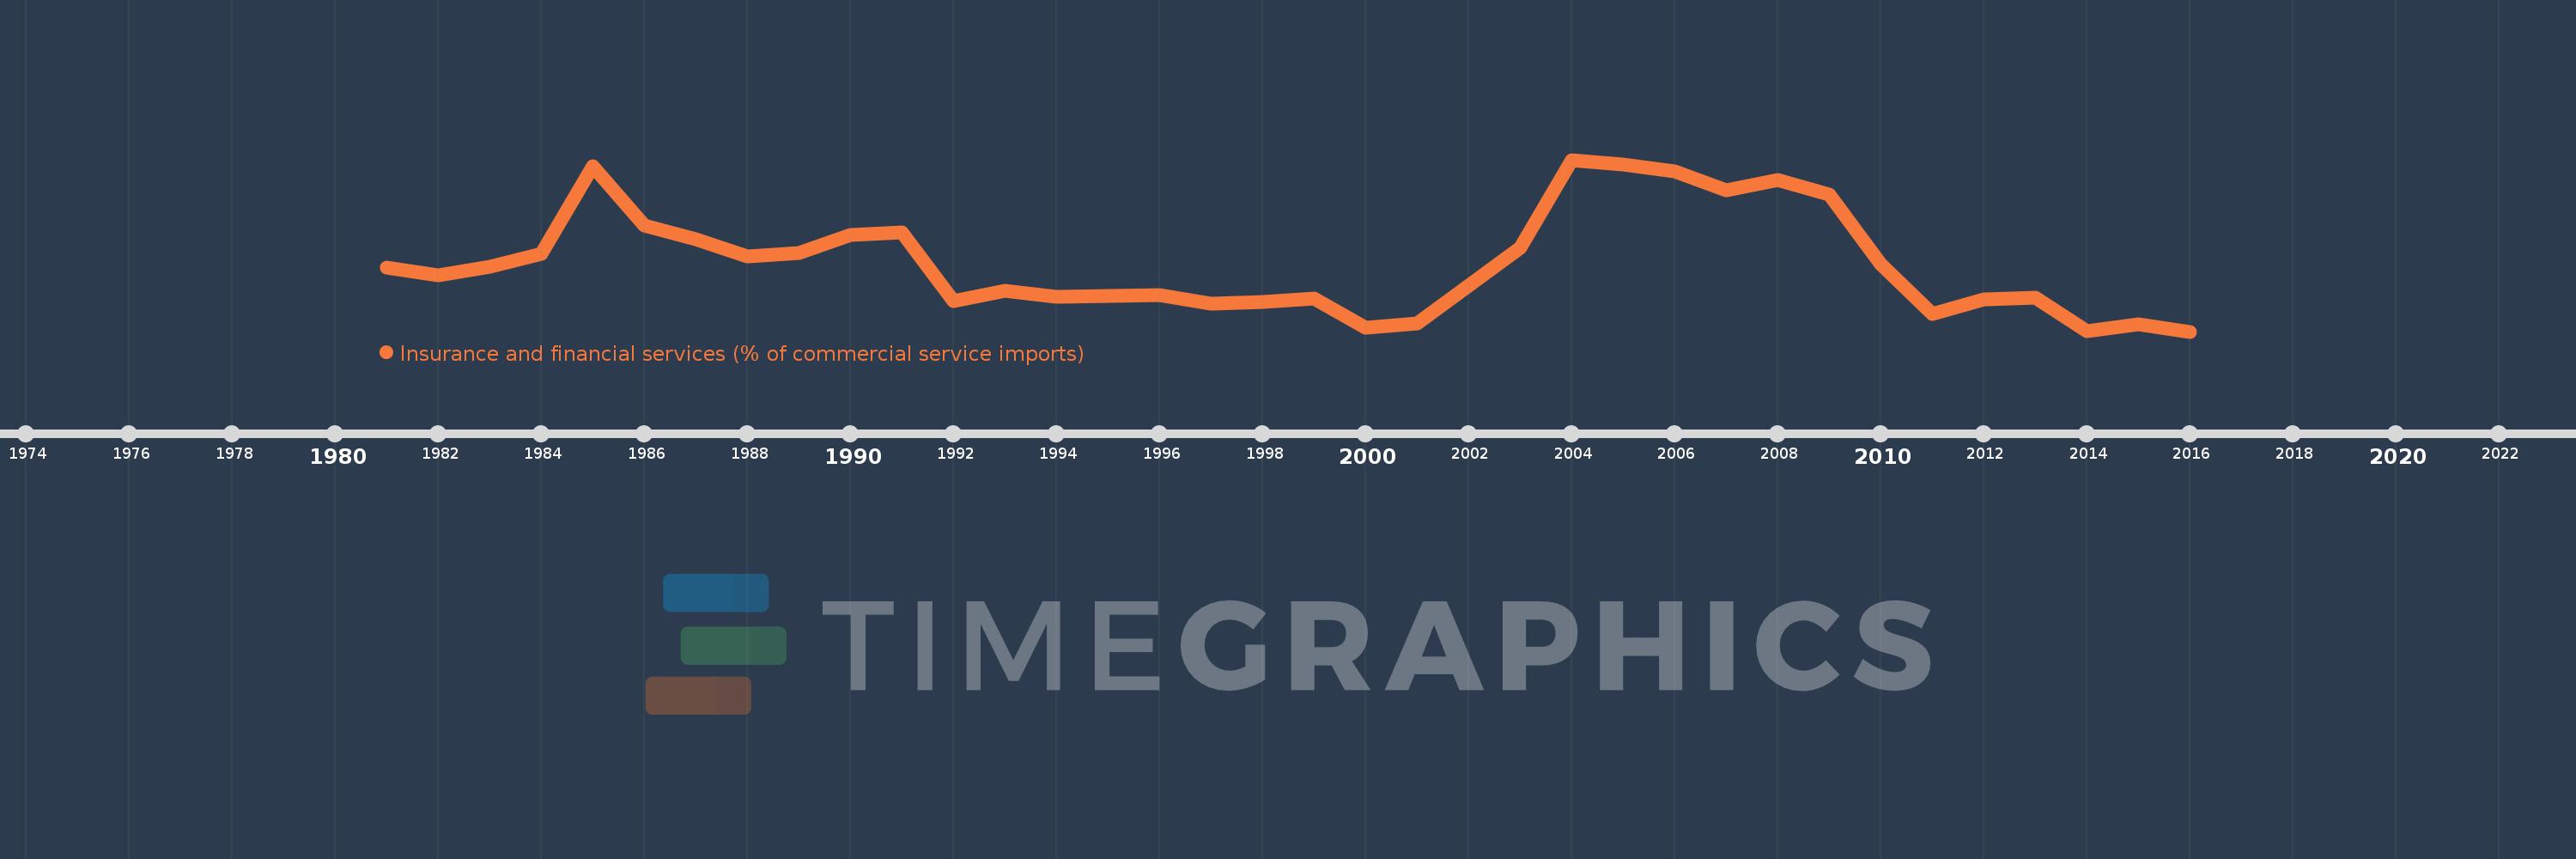
Insurance and financial services (% of commercial service imports)
2016,2015,2014,2013,2012,2011,2010,2009,2008,2007,2006,2005,2004,2003,2002,2001,2000,1999,1998,1997,1996,1995,1994,1993,1992,1991,1990,1989,1988,1987,1986,1985,1984,1983,1982,1981
Estas estadísticas en otros países:
AfghanistanAlbaniaAlgeriaAngolaAntigua and BarbudaArab WorldArgentinaArmeniaArubaAustraliaAustriaAzerbaijanBahamas, TheBahrainBangladeshBarbadosBelarusBelgiumBelizeBeninBermudaBhutanBoliviaBosnia and HerzegovinaBotswanaBrazilBrunei DarussalamBulgariaBurkina FasoBurundiCabo VerdeCambodiaCameroonCanadaCaribbean small statesCentral African RepublicCentral Europe and the BalticsChadChileChinaColombiaComorosCongo, Dem. Rep.Congo, Rep.Costa RicaCote d'IvoireCroatiaCuracaoCyprusCzech RepublicDenmarkDjiboutiDominicaDominican RepublicEarly-demographic dividendEast Asia & PacificEast Asia & Pacific (excluding high income)East Asia & Pacific (IDA & IBRD countries)EcuadorEgypt, Arab Rep.El SalvadorEquatorial GuineaEritreaEstoniaEthiopiaEuro areaEurope & Central AsiaEurope & Central Asia (excluding high income)Europe & Central Asia (IDA & IBRD countries)European UnionFaroe IslandsFijiFinlandFragile and conflict affected situationsFranceFrench PolynesiaGabonGambia, TheGeorgiaGermanyGhanaGreeceGrenadaGuatemalaGuineaGuinea-BissauGuyanaHaitiHeavily indebted poor countries (HIPC)High incomeHondurasHong Kong SAR, ChinaHungaryIBRD onlyIcelandIDA & IBRD totalIDA onlyIDA totalIndiaIndonesiaIran, Islamic Rep.IraqIrelandIsraelItalyJamaicaJapanJordanKazakhstanKenyaKiribatiKorea, Rep.KosovoKuwaitKyrgyz RepublicLao PDRLate-demographic dividendLatin America & Caribbean Latin America & Caribbean (excluding high income)Latin America & the Caribbean (IDA & IBRD countries)LatviaLeast developed countries: UN classificationLebanonLesothoLiberiaLibyaLithuaniaLow & middle incomeLow incomeLower middle incomeLuxembourgMacao SAR, ChinaMacedonia, FYRMadagascarMalawiMalaysiaMaldivesMaliMaltaMarshall IslandsMauritaniaMauritiusMexicoMicronesia, Fed. Sts.Middle East & North AfricaMiddle East & North Africa (excluding high income)Middle East & North Africa (IDA & IBRD countries)Middle incomeMoldovaMongoliaMontenegroMoroccoMozambiqueMyanmarNamibiaNepalNetherlandsNew CaledoniaNew ZealandNicaraguaNigerNigeriaNorth AmericaNorwayOECD membersOmanOther small statesPacific island small statesPakistanPalauPanamaPapua New GuineaParaguayPeruPhilippinesPolandPortugalPost-demographic dividendPre-demographic dividendQatarRomaniaRussian FederationRwandaSamoaSao Tome and PrincipeSaudi ArabiaSenegalSerbiaSeychellesSierra LeoneSingaporeSint Maarten (Dutch part)Slovak RepublicSloveniaSmall statesSolomon IslandsSouth AfricaSouth AsiaSouth Asia (IDA & IBRD)South SudanSpainSri LankaSt. Kitts and NevisSt. LuciaSt. Vincent and the GrenadinesSub-Saharan Africa Sub-Saharan Africa (excluding high income)Sub-Saharan Africa (IDA & IBRD countries)SudanSurinameSwazilandSwedenSwitzerlandSyrian Arab RepublicTajikistanTanzaniaThailandTimor-LesteTogoTongaTrinidad and TobagoTunisiaTurkeyTuvaluUgandaUkraineUnited KingdomUnited StatesUpper middle incomeUruguayVanuatuVenezuela, RBWest Bank and GazaWorldYemen, Rep.ZambiaZimbabwe línea de tiempo (timeline):
En esta escala de tiempo se presenta un gráfico de 1981 y 2016 de Uganda. Los datos de 1980 están ausentes. El número de observaciones reales por fecha: 36.
Fuente (nombre):
Indicadores del desarrollo mundial
Fuente (organización):
International Monetary Fund, Balance of Payments Statistics Yearbook and data files.
Categorías:
Private Sector, Trade
Se ha actualizado:
23 abr 2017 año
Los indicadores de los cambios de valor en los últimos años
Mínimo:
2.955
1 ene 2016 año
Máximo:
9.048
1 ene 2004 año
A la fecha de observación
Valor
Cambio absoluto
El cambio con respecto al valor anterior
1 ene 1981 año
5.235
+5.235
0.0%
1 ene 1982 año
4.945
-0.29
-5.53%
1 ene 1983 año
5.262
+0.317
6.4%
1 ene 1984 año
5.707
+0.445
8.45%
1 ene 1985 año
8.809
+3.103
54.37%
1 ene 1986 año
6.729
-2.081
-23.62%
1 ene 1987 año
6.224
-0.505
-7.5%
1 ene 1988 año
5.623
-0.601
-9.65%
1 ene 1989 año
5.736
+0.112
2.0%
1 ene 1990 año
6.395
+0.66
11.51%
1 ene 1991 año
6.482
+0.087
1.36%
1 ene 1992 año
4.024
-2.458
-37.92%
1 ene 1993 año
4.392
+0.368
9.16%
1 ene 1994 año
4.196
-0.196
-4.46%
1 ene 1995 año
4.217
+0.021
0.5%
1 ene 1996 año
4.246
+0.028
0.67%
1 ene 1997 año
3.94
-0.305
-7.2%
1 ene 1998 año
4.019
+0.079
2.0%
1 ene 1999 año
4.134
+0.115
2.87%
1 ene 2000 año
3.077
-1.057
-25.56%
1 ene 2001 año
3.248
+0.17
5.53%
1 ene 2002 año
4.579
+1.331
40.99%
1 ene 2003 año
5.92
+1.342
29.3%
1 ene 2004 año
9.048
+3.128
52.83%
1 ene 2005 año
8.874
-0.174
-1.93%
1 ene 2006 año
8.626
-0.248
-2.8%
1 ene 2007 año
7.969
-0.656
-7.61%
1 ene 2008 año
8.321
+0.351
4.41%
1 ene 2009 año
7.819
-0.501
-6.02%
1 ene 2010 año
5.351
-2.469
-31.57%
1 ene 2011 año
3.594
-1.757
-32.83%
1 ene 2012 año
4.094
+0.5
13.92%
1 ene 2013 año
4.156
+0.061
1.5%
1 ene 2014 año
2.969
-1.187
-28.56%
1 ene 2015 año
3.216
+0.247
8.33%
1 ene 2016 año
2.955
-0.261
-8.13%
Ranking de los países por los datos estadísticos actuales


Comentarios: