29
/es/
es
AIzaSyAYiBZKx7MnpbEhh9jyipgxe19OcubqV5w
April 1, 2024
47143
Lower middle income
LMC
false
2
1
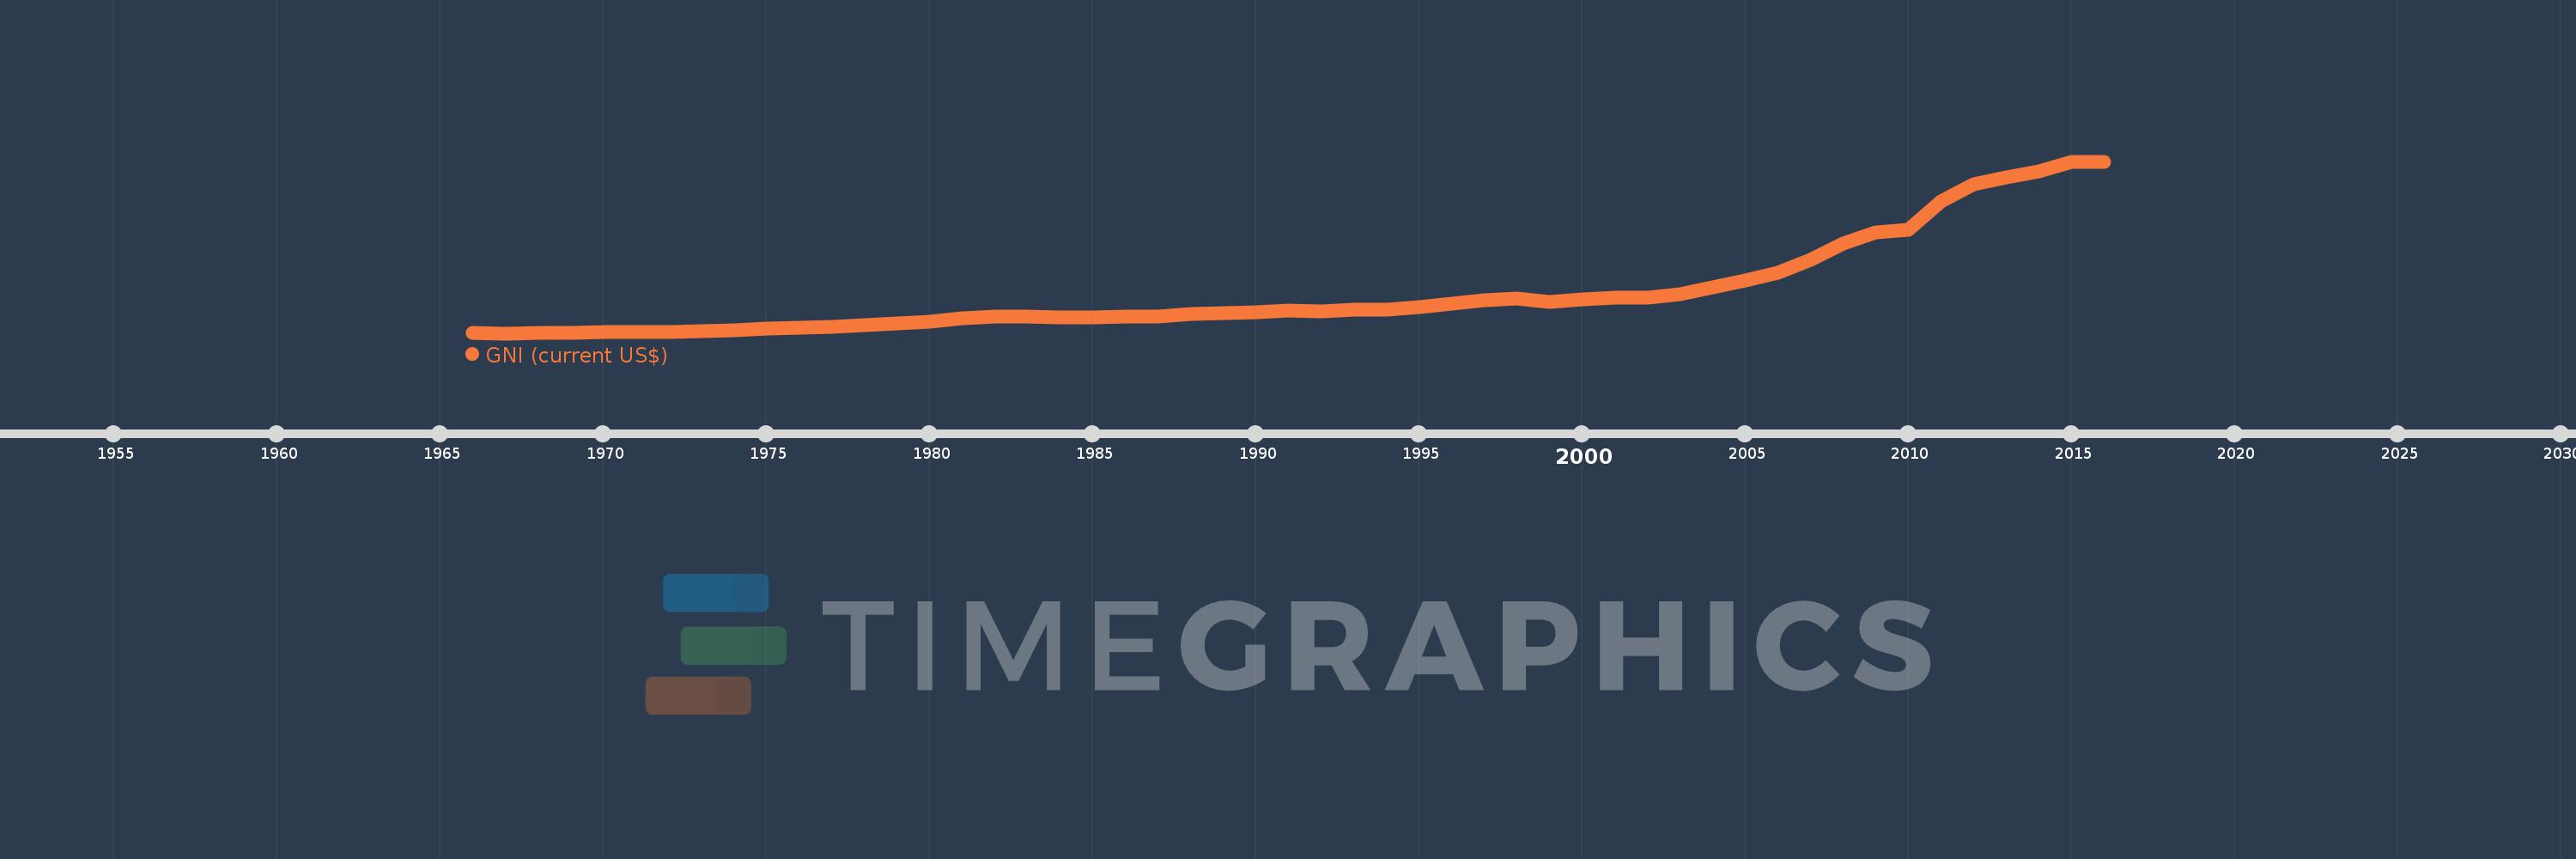
GNI (current US$)
2016,2015,2014,2013,2012,2011,2010,2009,2008,2007,2006,2005,2004,2003,2002,2001,2000,1999,1998,1997,1996,1995,1994,1993,1992,1991,1990,1989,1988,1987,1986,1985,1984,1983,1982,1981,1980,1979,1978,1977,1976,1975,1974,1973,1972,1971,1970,1969,1968,1967,1966
Estas estadísticas en otros países:
AfghanistanAlbaniaAlgeriaAmerican SamoaAndorraAngolaAntigua and BarbudaArab WorldArgentinaArmeniaAustraliaAustriaAzerbaijanBahamas, TheBahrainBangladeshBarbadosBelarusBelgiumBelizeBeninBermudaBhutanBoliviaBosnia and HerzegovinaBotswanaBrazilBrunei DarussalamBulgariaBurkina FasoBurundiCabo VerdeCambodiaCameroonCanadaCaribbean small statesCentral African RepublicCentral Europe and the BalticsChadChannel IslandsChileChinaColombiaComorosCongo, Dem. Rep.Congo, Rep.Costa RicaCote d'IvoireCroatiaCubaCyprusCzech RepublicDenmarkDjiboutiDominicaDominican RepublicEarly-demographic dividendEast Asia & PacificEast Asia & Pacific (excluding high income)East Asia & Pacific (IDA & IBRD countries)EcuadorEgypt, Arab Rep.El SalvadorEquatorial GuineaEritreaEstoniaEthiopiaEuro areaEurope & Central AsiaEurope & Central Asia (excluding high income)Europe & Central Asia (IDA & IBRD countries)European UnionFaroe IslandsFijiFinlandFragile and conflict affected situationsFranceFrench PolynesiaGabonGambia, TheGeorgiaGermanyGhanaGreeceGreenlandGrenadaGuatemalaGuineaGuinea-BissauGuyanaHaitiHeavily indebted poor countries (HIPC)High incomeHondurasHong Kong SAR, ChinaHungaryIBRD onlyIcelandIDA & IBRD totalIDA blendIDA onlyIDA totalIndiaIndonesiaIran, Islamic Rep.IraqIrelandIsle of ManIsraelItalyJamaicaJapanJordanKazakhstanKenyaKiribatiKorea, Rep.KosovoKuwaitKyrgyz RepublicLao PDRLate-demographic dividendLatin America & Caribbean Latin America & Caribbean (excluding high income)Latin America & the Caribbean (IDA & IBRD countries)LatviaLeast developed countries: UN classificationLebanonLesothoLiberiaLibyaLiechtensteinLithuaniaLow & middle incomeLow incomeLower middle incomeLuxembourgMacao SAR, ChinaMacedonia, FYRMadagascarMalawiMalaysiaMaldivesMaliMaltaMarshall IslandsMauritaniaMauritiusMexicoMicronesia, Fed. Sts.Middle East & North AfricaMiddle East & North Africa (excluding high income)Middle East & North Africa (IDA & IBRD countries)Middle incomeMoldovaMonacoMongoliaMontenegroMoroccoMozambiqueMyanmarNamibiaNauruNepalNetherlandsNew CaledoniaNew ZealandNicaraguaNigerNigeriaNorth AmericaNorwayOECD membersOmanOther small statesPacific island small statesPakistanPalauPanamaPapua New GuineaParaguayPeruPhilippinesPolandPortugalPost-demographic dividendPre-demographic dividendPuerto RicoQatarRomaniaRussian FederationRwandaSamoaSan MarinoSao Tome and PrincipeSaudi ArabiaSenegalSerbiaSeychellesSierra LeoneSingaporeSlovak RepublicSloveniaSmall statesSolomon IslandsSomaliaSouth AfricaSouth AsiaSouth Asia (IDA & IBRD)South SudanSpainSri LankaSt. Kitts and NevisSt. LuciaSt. Vincent and the GrenadinesSub-Saharan Africa Sub-Saharan Africa (excluding high income)Sub-Saharan Africa (IDA & IBRD countries)SudanSurinameSwazilandSwedenSwitzerlandSyrian Arab RepublicTajikistanTanzaniaThailandTimor-LesteTogoTongaTrinidad and TobagoTunisiaTurkeyTurkmenistanTuvaluUgandaUkraineUnited Arab EmiratesUnited KingdomUnited StatesUpper middle incomeUruguayUzbekistanVanuatuVenezuela, RBVietnamVirgin Islands (U.S.)West Bank and GazaWorldYemen, Rep.ZambiaZimbabwe línea de tiempo (timeline):
En esta escala de tiempo se presenta un gráfico de 1966 y 2016 de Lower middle income. Los datos de 1965 están ausentes. El número de observaciones reales por fecha: 51.
Fuente (nombre):
Indicadores del desarrollo mundial
Fuente (organización):
World Bank national accounts data, and OECD National Accounts data files.
Categorías:
Economy & Growth, External Debt
Se ha actualizado:
23 abr 2017 año
Los indicadores de los cambios de valor en los últimos años
En promedio:
1.488 billones
Mínimo:
118.877 bn
1 ene 1967 año
Máximo:
5.857 billones
1 ene 2015 año
A la fecha de observación
Valor
Cambio absoluto
El cambio con respecto al valor anterior
1 ene 1966 año
133.72 bn
+133.72 bn
0.0%
1 ene 1967 año
118.877 bn
-14.843 bn
-11.1%
1 ene 1968 año
126.518 bn
+7.641 bn
6.43%
1 ene 1969 año
136.084 bn
+9.566 bn
7.56%
1 ene 1970 año
151.923 bn
+15.839 bn
11.64%
1 ene 1971 año
167.146 bn
+15.223 bn
10.02%
1 ene 1972 año
174.451 bn
+7.305 bn
4.37%
1 ene 1973 año
188.366 bn
+13.916 bn
7.98%
1 ene 1974 año
223.61 bn
+35.244 bn
18.71%
1 ene 1975 año
288.012 bn
+64.402 bn
28.8%
1 ene 1976 año
319.541 bn
+31.528 bn
10.95%
1 ene 1977 año
346.398 bn
+26.857 bn
8.4%
1 ene 1978 año
397.929 bn
+51.531 bn
14.88%
1 ene 1979 año
446.717 bn
+48.788 bn
12.26%
1 ene 1980 año
507.266 bn
+60.549 bn
13.55%
1 ene 1981 año
626.908 bn
+119.643 bn
23.59%
1 ene 1982 año
666.091 bn
+39.182 bn
6.25%
1 ene 1983 año
666.043 bn
-47.937 millones
-0.01%
1 ene 1984 año
653.522 bn
-12.521 bn
-1.88%
1 ene 1985 año
645.345 bn
-8.177 bn
-1.25%
1 ene 1986 año
677.476 bn
+32.131 bn
4.98%
1 ene 1987 año
687.621 bn
+10.145 bn
1.5%
1 ene 1988 año
752.253 bn
+64.631 bn
9.4%
1 ene 1989 año
796.204 bn
+43.952 bn
5.84%
1 ene 1990 año
819.148 bn
+22.943 bn
2.88%
1 ene 1991 año
885.031 bn
+65.883 bn
8.04%
1 ene 1992 año
837.756 bn
-47.275 bn
-5.34%
1 ene 1993 año
895.558 bn
+57.803 bn
6.9%
1 ene 1994 año
908.941 bn
+13.383 bn
1.49%
1 ene 1995 año
997.059 bn
+88.118 bn
9.69%
1 ene 1996 año
1.12 billones
+123.357 bn
12.37%
1 ene 1997 año
1.231 billones
+110.684 bn
9.88%
1 ene 1998 año
1.274 billones
+43.244 bn
3.51%
1 ene 1999 año
1.159 billones
-115.352 bn
-9.05%
1 ene 2000 año
1.253 billones
+94.365 bn
8.14%
1 ene 2001 año
1.31 billones
+56.528 bn
4.51%
1 ene 2002 año
1.323 billones
+12.744 bn
0.97%
1 ene 2003 año
1.413 billones
+90.303 bn
6.83%
1 ene 2004 año
1.64 billones
+227.397 bn
16.09%
1 ene 2005 año
1.87 billones
+229.196 bn
13.97%
1 ene 2006 año
2.149 billones
+279.419 bn
14.95%
1 ene 2007 año
2.558 billones
+409.42 bn
19.05%
1 ene 2008 año
3.107 billones
+548.934 bn
21.46%
1 ene 2009 año
3.48 billones
+372.805 bn
12.0%
1 ene 2010 año
3.583 billones
+102.632 bn
2.95%
1 ene 2011 año
4.537 billones
+954.132 bn
26.63%
1 ene 2012 año
5.091 billones
+554.274 bn
12.22%
1 ene 2013 año
5.33 billones
+238.827 bn
4.69%
1 ene 2014 año
5.541 billones
+211.097 bn
3.96%
1 ene 2015 año
5.857 billones
+316.272 bn
5.71%
1 ene 2016 año
5.839 billones
-18.303 bn
-0.31%
Ranking de los países por los datos estadísticos actuales


Comentarios: