29
/es/
es
AIzaSyAYiBZKx7MnpbEhh9jyipgxe19OcubqV5w
April 1, 2024
134128
France
FRA
true
2
1
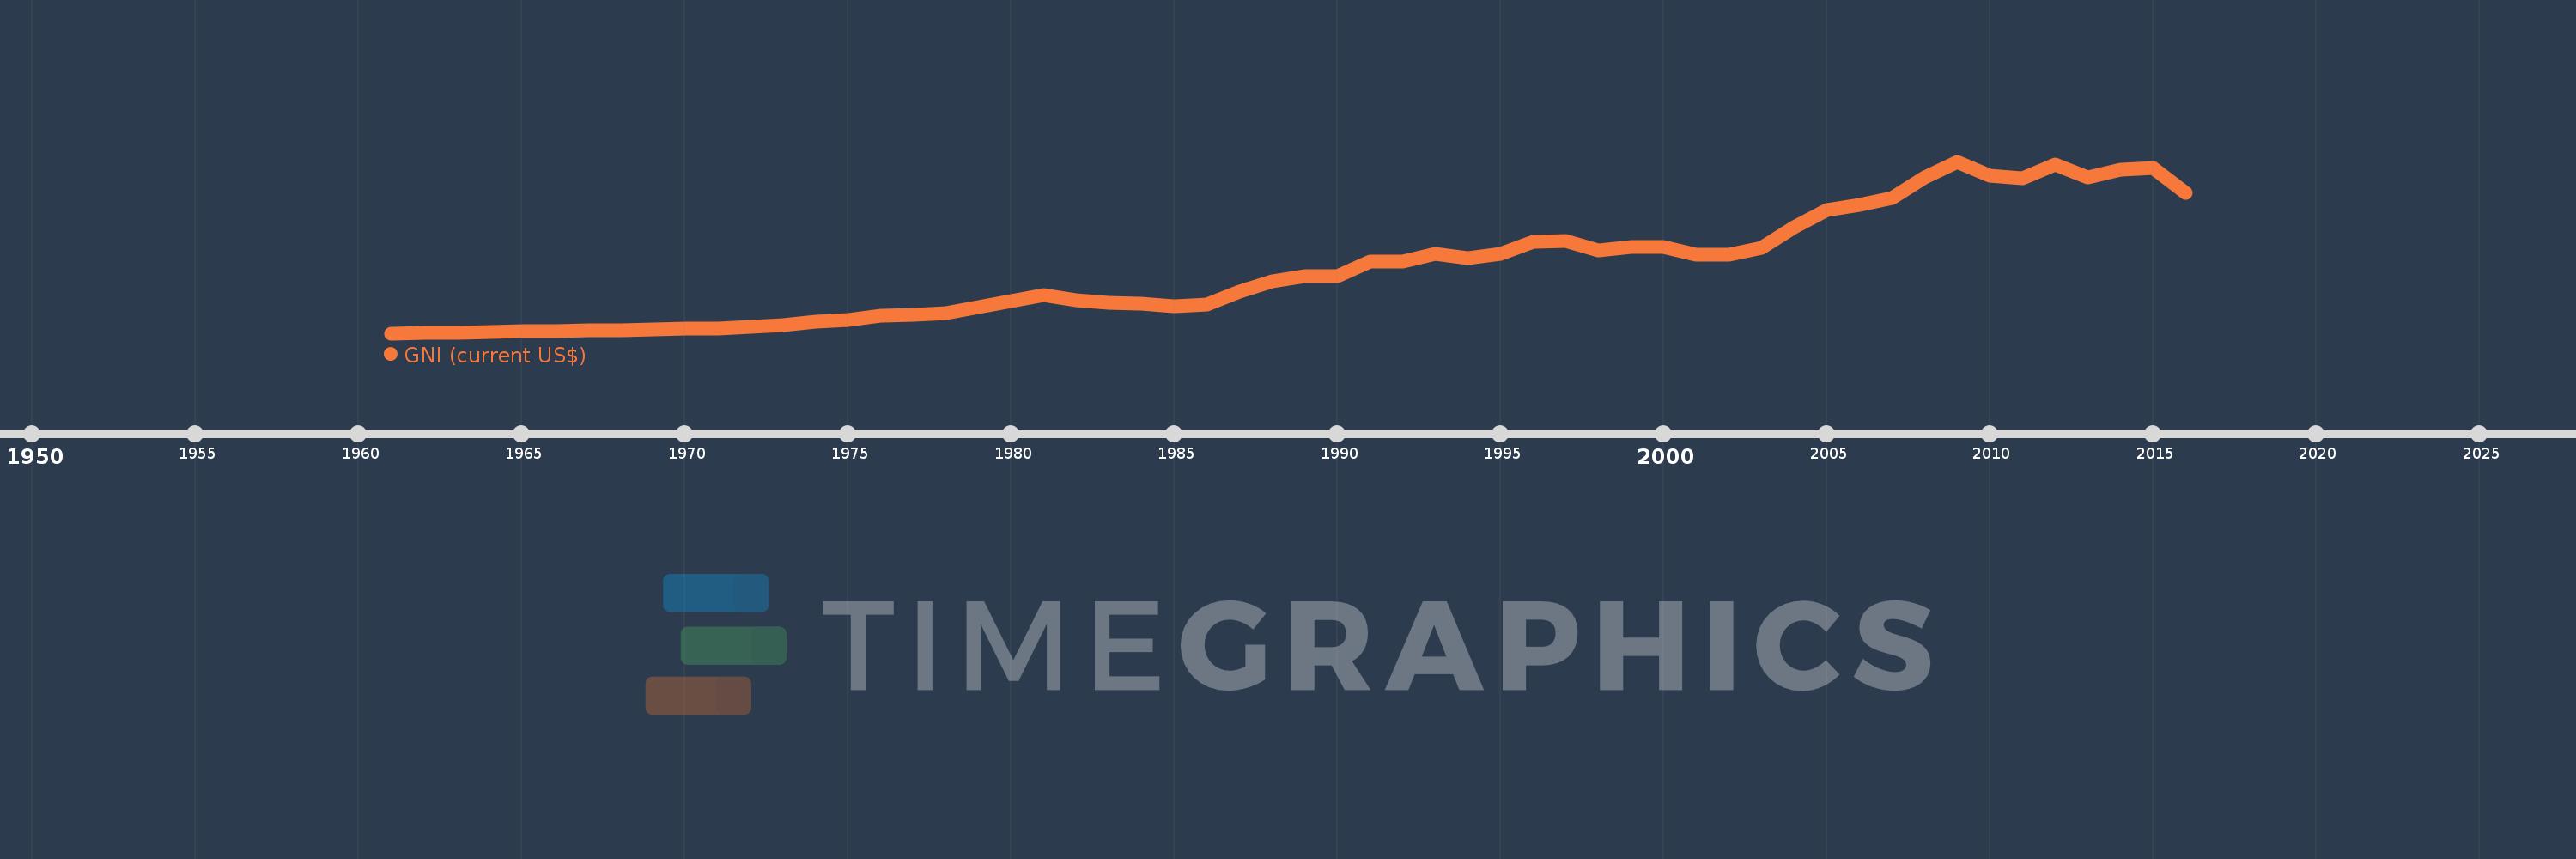
GNI (current US$)
2016,2015,2014,2013,2012,2011,2010,2009,2008,2007,2006,2005,2004,2003,2002,2001,2000,1999,1998,1997,1996,1995,1994,1993,1992,1991,1990,1989,1988,1987,1986,1985,1984,1983,1982,1981,1980,1979,1978,1977,1976,1975,1974,1973,1972,1971,1970,1969,1968,1967,1966,1965,1964,1963,1962,1961
Estas estadísticas en otros países:
AfghanistanAlbaniaAlgeriaAmerican SamoaAndorraAngolaAntigua and BarbudaArab WorldArgentinaArmeniaAustraliaAustriaAzerbaijanBahamas, TheBahrainBangladeshBarbadosBelarusBelgiumBelizeBeninBermudaBhutanBoliviaBosnia and HerzegovinaBotswanaBrazilBrunei DarussalamBulgariaBurkina FasoBurundiCabo VerdeCambodiaCameroonCanadaCaribbean small statesCentral African RepublicCentral Europe and the BalticsChadChannel IslandsChileChinaColombiaComorosCongo, Dem. Rep.Congo, Rep.Costa RicaCote d'IvoireCroatiaCubaCyprusCzech RepublicDenmarkDjiboutiDominicaDominican RepublicEarly-demographic dividendEast Asia & PacificEast Asia & Pacific (excluding high income)East Asia & Pacific (IDA & IBRD countries)EcuadorEgypt, Arab Rep.El SalvadorEquatorial GuineaEritreaEstoniaEthiopiaEuro areaEurope & Central AsiaEurope & Central Asia (excluding high income)Europe & Central Asia (IDA & IBRD countries)European UnionFaroe IslandsFijiFinlandFragile and conflict affected situationsFranceFrench PolynesiaGabonGambia, TheGeorgiaGermanyGhanaGreeceGreenlandGrenadaGuatemalaGuineaGuinea-BissauGuyanaHaitiHeavily indebted poor countries (HIPC)High incomeHondurasHong Kong SAR, ChinaHungaryIBRD onlyIcelandIDA & IBRD totalIDA blendIDA onlyIDA totalIndiaIndonesiaIran, Islamic Rep.IraqIrelandIsle of ManIsraelItalyJamaicaJapanJordanKazakhstanKenyaKiribatiKorea, Rep.KosovoKuwaitKyrgyz RepublicLao PDRLate-demographic dividendLatin America & Caribbean Latin America & Caribbean (excluding high income)Latin America & the Caribbean (IDA & IBRD countries)LatviaLeast developed countries: UN classificationLebanonLesothoLiberiaLibyaLiechtensteinLithuaniaLow & middle incomeLow incomeLower middle incomeLuxembourgMacao SAR, ChinaMacedonia, FYRMadagascarMalawiMalaysiaMaldivesMaliMaltaMarshall IslandsMauritaniaMauritiusMexicoMicronesia, Fed. Sts.Middle East & North AfricaMiddle East & North Africa (excluding high income)Middle East & North Africa (IDA & IBRD countries)Middle incomeMoldovaMonacoMongoliaMontenegroMoroccoMozambiqueMyanmarNamibiaNauruNepalNetherlandsNew CaledoniaNew ZealandNicaraguaNigerNigeriaNorth AmericaNorwayOECD membersOmanOther small statesPacific island small statesPakistanPalauPanamaPapua New GuineaParaguayPeruPhilippinesPolandPortugalPost-demographic dividendPre-demographic dividendPuerto RicoQatarRomaniaRussian FederationRwandaSamoaSan MarinoSao Tome and PrincipeSaudi ArabiaSenegalSerbiaSeychellesSierra LeoneSingaporeSlovak RepublicSloveniaSmall statesSolomon IslandsSomaliaSouth AfricaSouth AsiaSouth Asia (IDA & IBRD)South SudanSpainSri LankaSt. Kitts and NevisSt. LuciaSt. Vincent and the GrenadinesSub-Saharan Africa Sub-Saharan Africa (excluding high income)Sub-Saharan Africa (IDA & IBRD countries)SudanSurinameSwazilandSwedenSwitzerlandSyrian Arab RepublicTajikistanTanzaniaThailandTimor-LesteTogoTongaTrinidad and TobagoTunisiaTurkeyTurkmenistanTuvaluUgandaUkraineUnited Arab EmiratesUnited KingdomUnited StatesUpper middle incomeUruguayUzbekistanVanuatuVenezuela, RBVietnamVirgin Islands (U.S.)West Bank and GazaWorldYemen, Rep.ZambiaZimbabwe línea de tiempo (timeline):
En esta escala de tiempo se presenta un gráfico de 1961 y 2016 de France. Los datos de 1960 están ausentes. El número de observaciones reales por fecha: 56.
Fuente (nombre):
Indicadores del desarrollo mundial
Fuente (organización):
World Bank national accounts data, and OECD National Accounts data files.
Categorías:
Economy & Growth, External Debt
Se ha actualizado:
23 abr 2017 año
Los indicadores de los cambios de valor en los últimos años
En promedio:
1.146 billones
Mínimo:
63.184 bn
1 ene 1961 año
Máximo:
2.986 billones
1 ene 2009 año
A la fecha de observación
Valor
Cambio absoluto
El cambio con respecto al valor anterior
1 ene 1961 año
63.184 bn
+63.184 bn
0.0%
1 ene 1962 año
68.883 bn
+5.699 bn
9.02%
1 ene 1963 año
76.999 bn
+8.116 bn
11.78%
1 ene 1964 año
86.36 bn
+9.361 bn
12.16%
1 ene 1965 año
95.788 bn
+9.428 bn
10.92%
1 ene 1966 año
103.102 bn
+7.314 bn
7.64%
1 ene 1967 año
111.516 bn
+8.414 bn
8.16%
1 ene 1968 año
120.498 bn
+8.982 bn
8.05%
1 ene 1969 año
130.881 bn
+10.383 bn
8.62%
1 ene 1970 año
141.767 bn
+10.886 bn
8.32%
1 ene 1971 año
149.622 bn
+7.855 bn
5.54%
1 ene 1972 año
167.459 bn
+17.837 bn
11.92%
1 ene 1973 año
205.179 bn
+37.72 bn
22.52%
1 ene 1974 año
266.26 bn
+61.08 bn
29.77%
1 ene 1975 año
287.222 bn
+20.962 bn
7.87%
1 ene 1976 año
363.07 bn
+75.848 bn
26.41%
1 ene 1977 año
374.608 bn
+11.538 bn
3.18%
1 ene 1978 año
412.588 bn
+37.98 bn
10.14%
1 ene 1979 año
509.778 bn
+97.19 bn
23.56%
1 ene 1980 año
618.471 bn
+108.693 bn
21.32%
1 ene 1981 año
708.636 bn
+90.165 bn
14.58%
1 ene 1982 año
621.867 bn
-86.768 bn
-12.24%
1 ene 1983 año
588.762 bn
-33.105 bn
-5.32%
1 ene 1984 año
560.219 bn
-28.543 bn
-4.85%
1 ene 1985 año
530.11 bn
-30.109 bn
-5.37%
1 ene 1986 año
555.348 bn
+25.238 bn
4.76%
1 ene 1987 año
778.751 bn
+223.403 bn
40.23%
1 ene 1988 año
946.388 bn
+167.637 bn
21.53%
1 ene 1989 año
1.031 billones
+84.118 bn
8.89%
1 ene 1990 año
1.035 billones
+4.191 bn
0.41%
1 ene 1991 año
1.281 billones
+246.12 bn
23.79%
1 ene 1992 año
1.281 billones
-186.61 millones
-0.01%
1 ene 1993 año
1.417 billones
+136.444 bn
10.65%
1 ene 1994 año
1.339 billones
-77.694 bn
-5.48%
1 ene 1995 año
1.409 billones
+69.175 bn
5.16%
1 ene 1996 año
1.617 billones
+208.756 bn
14.82%
1 ene 1997 año
1.629 billones
+12.113 bn
0.75%
1 ene 1998 año
1.479 billones
-150.011 bn
-9.21%
1 ene 1999 año
1.531 billones
+51.564 bn
3.49%
1 ene 2000 año
1.531 billones
-39.752 millones
0.0%
1 ene 2001 año
1.394 billones
-136.892 bn
-8.94%
1 ene 2002 año
1.407 billones
+13.036 bn
0.94%
1 ene 2003 año
1.516 billones
+108.495 bn
7.71%
1 ene 2004 año
1.871 billones
+355.673 bn
23.47%
1 ene 2005 año
2.155 billones
+283.753 bn
15.16%
1 ene 2006 año
2.242 billones
+87.206 bn
4.05%
1 ene 2007 año
2.372 billones
+129.565 bn
5.78%
1 ene 2008 año
2.719 billones
+346.763 bn
14.62%
1 ene 2009 año
2.986 billones
+267.346 bn
9.83%
1 ene 2010 año
2.742 billones
-243.944 bn
-8.17%
1 ene 2011 año
2.701 billones
-40.912 bn
-1.49%
1 ene 2012 año
2.928 billones
+227.39 bn
8.42%
1 ene 2013 año
2.719 billones
-208.97 bn
-7.14%
1 ene 2014 año
2.848 billones
+128.224 bn
4.72%
1 ene 2015 año
2.877 billones
+29.048 bn
1.02%
1 ene 2016 año
2.458 billones
-418.601 bn
-14.55%
Ranking de los países por los datos estadísticos actuales


Comentarios: