29
/es/
es
AIzaSyAYiBZKx7MnpbEhh9jyipgxe19OcubqV5w
April 1, 2024
156008
Indonesia
IDN
true
2
1
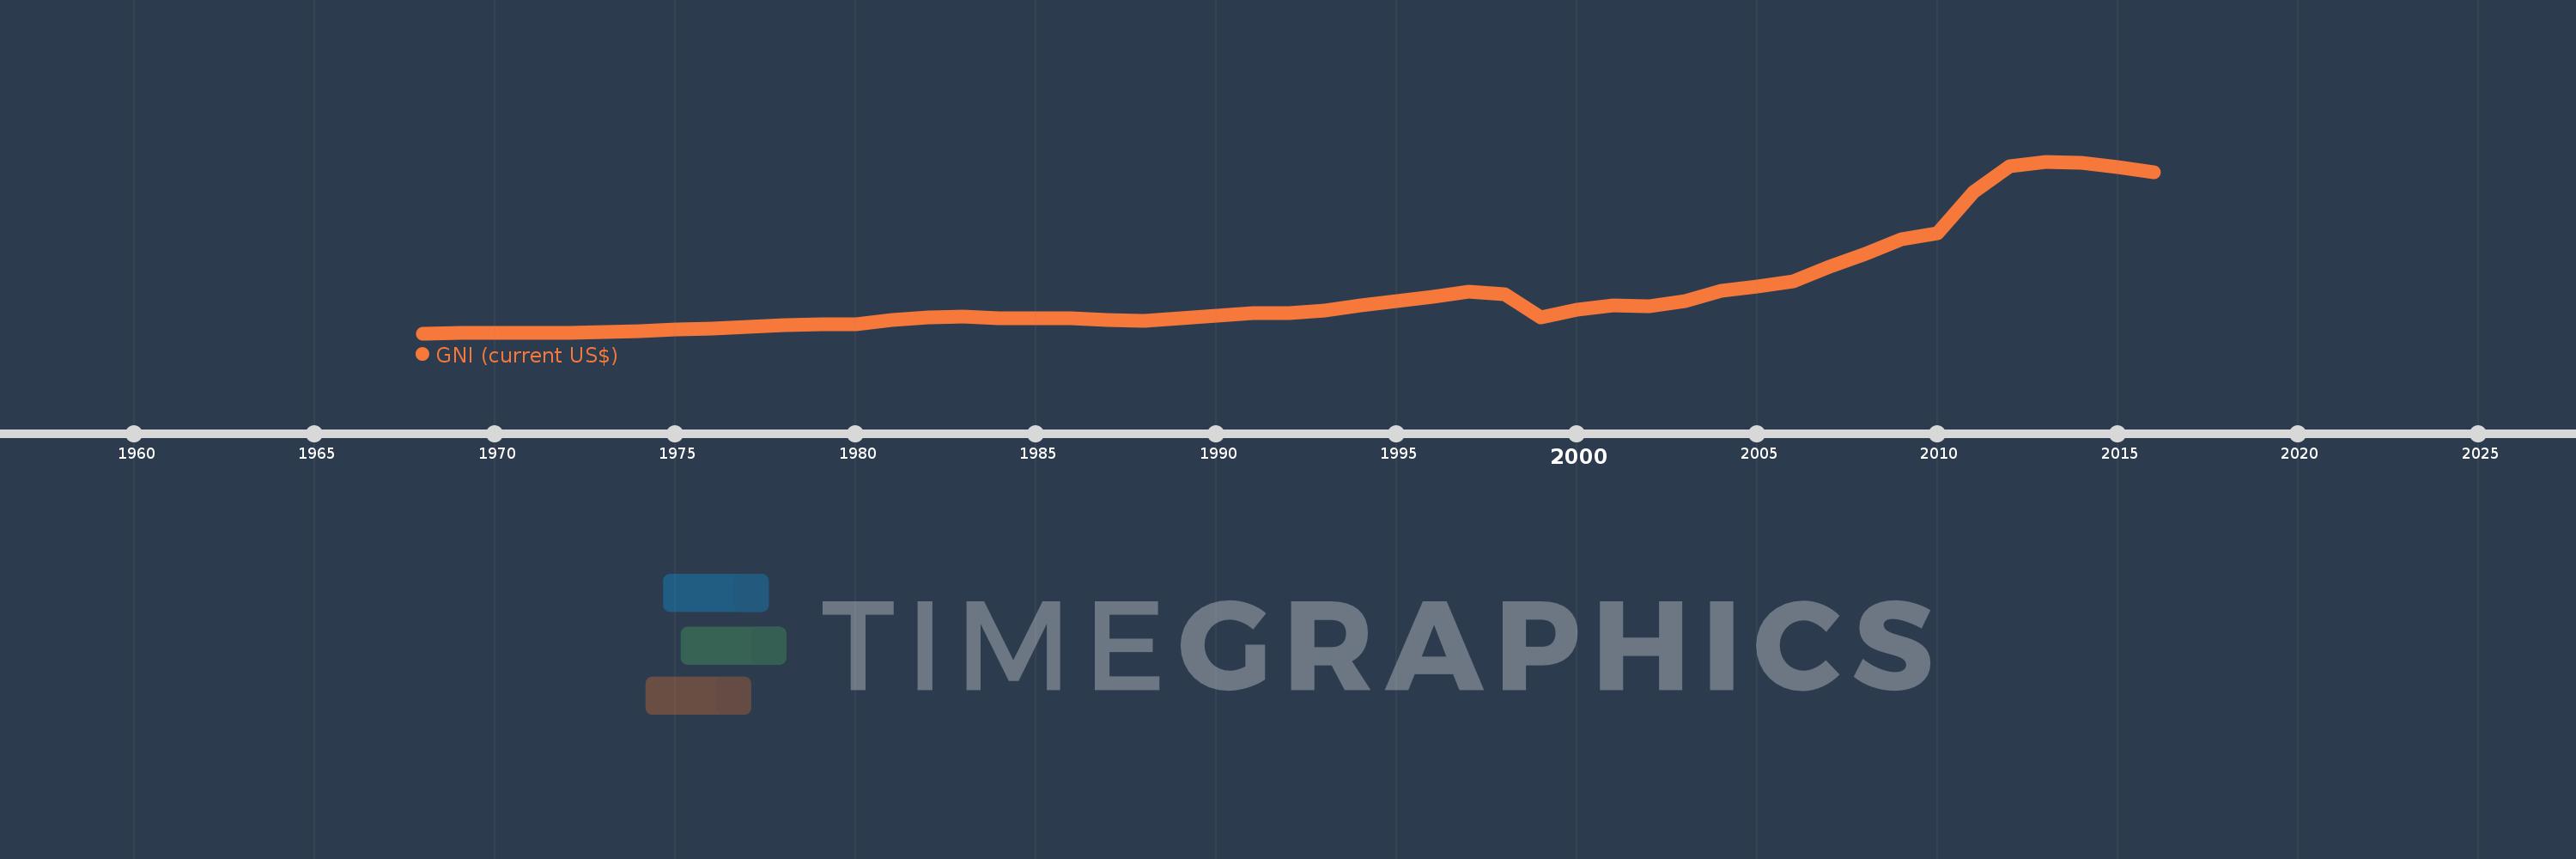
GNI (current US$)
2016,2015,2014,2013,2012,2011,2010,2009,2008,2007,2006,2005,2004,2003,2002,2001,2000,1999,1998,1997,1996,1995,1994,1993,1992,1991,1990,1989,1988,1987,1986,1985,1984,1983,1982,1981,1980,1979,1978,1977,1976,1975,1974,1973,1972,1971,1970,1969,1968
Estas estadísticas en otros países:
AfghanistanAlbaniaAlgeriaAmerican SamoaAndorraAngolaAntigua and BarbudaArab WorldArgentinaArmeniaAustraliaAustriaAzerbaijanBahamas, TheBahrainBangladeshBarbadosBelarusBelgiumBelizeBeninBermudaBhutanBoliviaBosnia and HerzegovinaBotswanaBrazilBrunei DarussalamBulgariaBurkina FasoBurundiCabo VerdeCambodiaCameroonCanadaCaribbean small statesCentral African RepublicCentral Europe and the BalticsChadChannel IslandsChileChinaColombiaComorosCongo, Dem. Rep.Congo, Rep.Costa RicaCote d'IvoireCroatiaCubaCyprusCzech RepublicDenmarkDjiboutiDominicaDominican RepublicEarly-demographic dividendEast Asia & PacificEast Asia & Pacific (excluding high income)East Asia & Pacific (IDA & IBRD countries)EcuadorEgypt, Arab Rep.El SalvadorEquatorial GuineaEritreaEstoniaEthiopiaEuro areaEurope & Central AsiaEurope & Central Asia (excluding high income)Europe & Central Asia (IDA & IBRD countries)European UnionFaroe IslandsFijiFinlandFragile and conflict affected situationsFranceFrench PolynesiaGabonGambia, TheGeorgiaGermanyGhanaGreeceGreenlandGrenadaGuatemalaGuineaGuinea-BissauGuyanaHaitiHeavily indebted poor countries (HIPC)High incomeHondurasHong Kong SAR, ChinaHungaryIBRD onlyIcelandIDA & IBRD totalIDA blendIDA onlyIDA totalIndiaIndonesiaIran, Islamic Rep.IraqIrelandIsle of ManIsraelItalyJamaicaJapanJordanKazakhstanKenyaKiribatiKorea, Rep.KosovoKuwaitKyrgyz RepublicLao PDRLate-demographic dividendLatin America & Caribbean Latin America & Caribbean (excluding high income)Latin America & the Caribbean (IDA & IBRD countries)LatviaLeast developed countries: UN classificationLebanonLesothoLiberiaLibyaLiechtensteinLithuaniaLow & middle incomeLow incomeLower middle incomeLuxembourgMacao SAR, ChinaMacedonia, FYRMadagascarMalawiMalaysiaMaldivesMaliMaltaMarshall IslandsMauritaniaMauritiusMexicoMicronesia, Fed. Sts.Middle East & North AfricaMiddle East & North Africa (excluding high income)Middle East & North Africa (IDA & IBRD countries)Middle incomeMoldovaMonacoMongoliaMontenegroMoroccoMozambiqueMyanmarNamibiaNauruNepalNetherlandsNew CaledoniaNew ZealandNicaraguaNigerNigeriaNorth AmericaNorwayOECD membersOmanOther small statesPacific island small statesPakistanPalauPanamaPapua New GuineaParaguayPeruPhilippinesPolandPortugalPost-demographic dividendPre-demographic dividendPuerto RicoQatarRomaniaRussian FederationRwandaSamoaSan MarinoSao Tome and PrincipeSaudi ArabiaSenegalSerbiaSeychellesSierra LeoneSingaporeSlovak RepublicSloveniaSmall statesSolomon IslandsSomaliaSouth AfricaSouth AsiaSouth Asia (IDA & IBRD)South SudanSpainSri LankaSt. Kitts and NevisSt. LuciaSt. Vincent and the GrenadinesSub-Saharan Africa Sub-Saharan Africa (excluding high income)Sub-Saharan Africa (IDA & IBRD countries)SudanSurinameSwazilandSwedenSwitzerlandSyrian Arab RepublicTajikistanTanzaniaThailandTimor-LesteTogoTongaTrinidad and TobagoTunisiaTurkeyTurkmenistanTuvaluUgandaUkraineUnited Arab EmiratesUnited KingdomUnited StatesUpper middle incomeUruguayUzbekistanVanuatuVenezuela, RBVietnamVirgin Islands (U.S.)West Bank and GazaWorldYemen, Rep.ZambiaZimbabwe línea de tiempo (timeline):
En esta escala de tiempo se presenta un gráfico de 1968 y 2016 de Indonesia. Los datos de 1967 están ausentes. El número de observaciones reales por fecha: 49.
Fuente (nombre):
Indicadores del desarrollo mundial
Fuente (organización):
World Bank national accounts data, and OECD National Accounts data files.
Categorías:
Economy & Growth, External Debt
Se ha actualizado:
23 abr 2017 año
Los indicadores de los cambios de valor en los últimos años
Mínimo:
6.029 bn
1 ene 1968 año
Máximo:
891.242 bn
1 ene 2013 año
A la fecha de observación
Valor
Cambio absoluto
El cambio con respecto al valor anterior
1 ene 1968 año
6.029 bn
+6.029 bn
0.0%
1 ene 1969 año
7.509 bn
+1.48 bn
24.55%
1 ene 1970 año
8.856 bn
+1.347 bn
17.94%
1 ene 1971 año
9.698 bn
+841.513 millones
9.5%
1 ene 1972 año
9.856 bn
+158.474 millones
1.63%
1 ene 1973 año
11.459 bn
+1.603 bn
16.26%
1 ene 1974 año
16.873 bn
+5.413 bn
47.24%
1 ene 1975 año
26.468 bn
+9.595 bn
56.87%
1 ene 1976 año
31.334 bn
+4.867 bn
18.39%
1 ene 1977 año
38.848 bn
+7.513 bn
23.98%
1 ene 1978 año
47.587 bn
+8.74 bn
22.5%
1 ene 1979 año
53.253 bn
+5.665 bn
11.91%
1 ene 1980 año
52.74 bn
-512.612 millones
-0.96%
1 ene 1981 año
74.806 bn
+22.066 bn
41.84%
1 ene 1982 año
89.427 bn
+14.621 bn
19.54%
1 ene 1983 año
90.125 bn
+698.193 millones
0.78%
1 ene 1984 año
81.876 bn
-8.249 bn
-9.15%
1 ene 1985 año
82.5 bn
+623.486 millones
0.76%
1 ene 1986 año
82.777 bn
+276.61 millones
0.34%
1 ene 1987 año
76.004 bn
-6.772 bn
-8.18%
1 ene 1988 año
71.904 bn
-4.1 bn
-5.39%
1 ene 1989 año
84.682 bn
+12.777 bn
17.77%
1 ene 1990 año
96.894 bn
+12.212 bn
14.42%
1 ene 1991 año
109.209 bn
+12.315 bn
12.71%
1 ene 1992 año
111.034 bn
+1.825 bn
1.67%
1 ene 1993 año
121.895 bn
+10.862 bn
9.78%
1 ene 1994 año
151.992 bn
+30.097 bn
24.69%
1 ene 1995 año
172.149 bn
+20.157 bn
13.26%
1 ene 1996 año
196.188 bn
+24.039 bn
13.96%
1 ene 1997 año
221.276 bn
+25.089 bn
12.79%
1 ene 1998 año
209.44 bn
-11.836 bn
-5.35%
1 ene 1999 año
90.063 bn
-119.376 bn
-57.0%
1 ene 2000 año
129.338 bn
+39.274 bn
43.61%
1 ene 2001 año
150.317 bn
+20.98 bn
16.22%
1 ene 2002 año
143.412 bn
-6.905 bn
-4.59%
1 ene 2003 año
172.378 bn
+28.966 bn
20.2%
1 ene 2004 año
225.747 bn
+53.369 bn
30.96%
1 ene 2005 año
245.051 bn
+19.304 bn
8.55%
1 ene 2006 año
271.958 bn
+26.907 bn
10.98%
1 ene 2007 año
349.038 bn
+77.08 bn
28.34%
1 ene 2008 año
414.441 bn
+65.404 bn
18.74%
1 ene 2009 año
492.096 bn
+77.655 bn
18.74%
1 ene 2010 año
520.695 bn
+28.598 bn
5.81%
1 ene 2011 año
734.396 bn
+213.701 bn
41.04%
1 ene 2012 año
866.422 bn
+132.026 bn
17.98%
1 ene 2013 año
891.242 bn
+24.82 bn
2.86%
1 ene 2014 año
885.469 bn
-5.773 bn
-0.65%
1 ene 2015 año
860.795 bn
-24.674 bn
-2.79%
1 ene 2016 año
833.906 bn
-26.889 bn
-3.12%
Ranking de los países por los datos estadísticos actuales


Comentarios: