29
/es/
es
AIzaSyAYiBZKx7MnpbEhh9jyipgxe19OcubqV5w
April 1, 2024
46808
Lower middle income
LMC
false
2
1
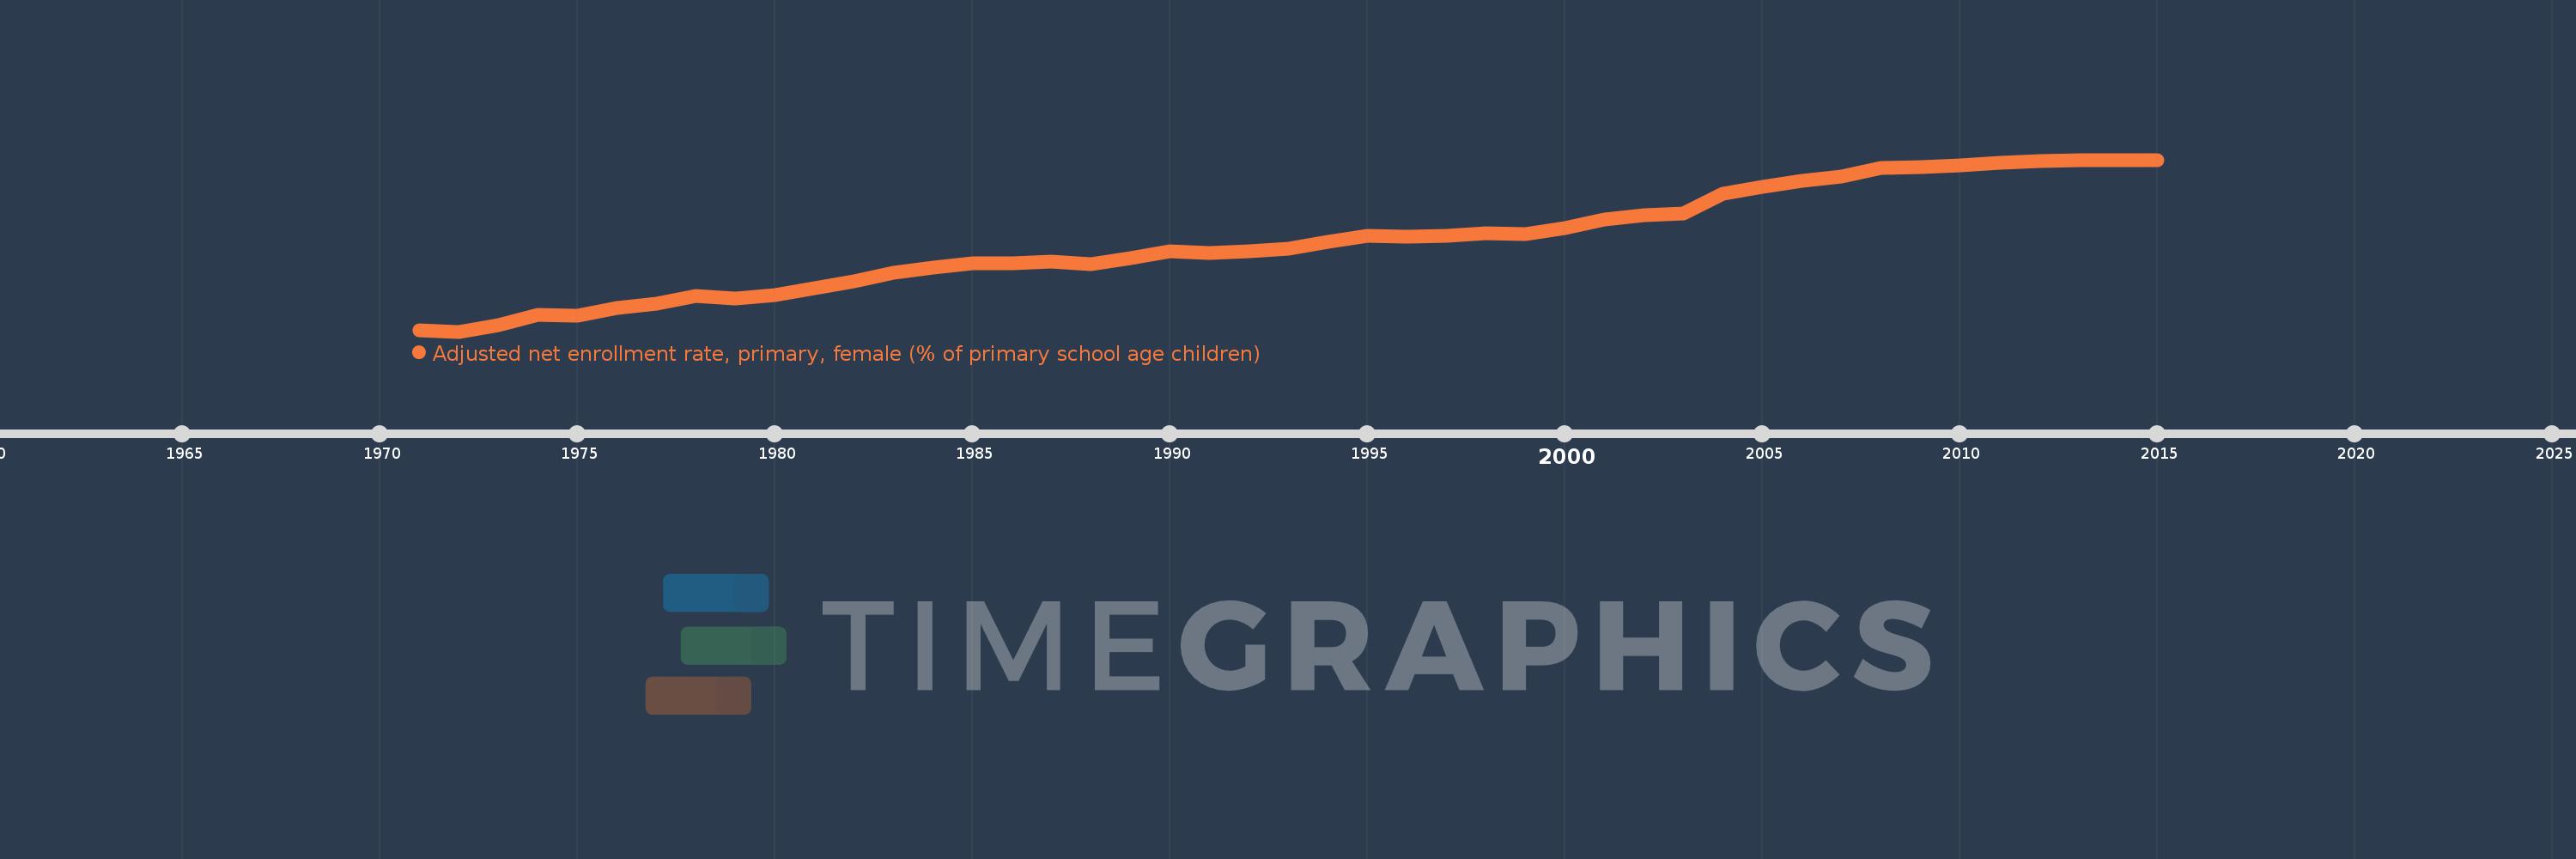
Adjusted net enrollment rate, primary, female (% of primary school age children)
2015,2014,2013,2012,2011,2010,2009,2008,2007,2006,2005,2004,2003,2002,2001,2000,1999,1998,1997,1996,1995,1994,1993,1992,1991,1990,1989,1988,1987,1986,1985,1984,1983,1982,1981,1980,1979,1978,1977,1976,1975,1974,1973,1972,1971
Estas estadísticas en otros países:
AfghanistanAlbaniaAlgeriaAngolaAntigua and BarbudaArab WorldArgentinaArmeniaArubaAustraliaAustriaAzerbaijanBahamas, TheBahrainBangladeshBarbadosBelarusBelgiumBelizeBeninBermudaBhutanBoliviaBosnia and HerzegovinaBotswanaBrazilBrunei DarussalamBulgariaBurkina FasoBurundiCabo VerdeCambodiaCameroonCanadaCaribbean small statesCentral African RepublicCentral Europe and the BalticsChadChileChinaColombiaComorosCongo, Dem. Rep.Congo, Rep.Costa RicaCote d'IvoireCroatiaCubaCyprusDenmarkDjiboutiDominicaDominican RepublicEarly-demographic dividendEast Asia & PacificEast Asia & Pacific (excluding high income)East Asia & Pacific (IDA & IBRD countries)EcuadorEgypt, Arab Rep.El SalvadorEquatorial GuineaEritreaEstoniaEthiopiaEuro areaEurope & Central AsiaEurope & Central Asia (excluding high income)Europe & Central Asia (IDA & IBRD countries)European UnionFijiFinlandFragile and conflict affected situationsFranceGabonGambia, TheGeorgiaGhanaGreeceGrenadaGuatemalaGuineaGuinea-BissauGuyanaHaitiHeavily indebted poor countries (HIPC)High incomeHondurasHong Kong SAR, ChinaHungaryIBRD onlyIcelandIDA & IBRD totalIDA blendIDA onlyIDA totalIndiaIndonesiaIran, Islamic Rep.IraqIrelandIsraelItalyJamaicaJapanJordanKazakhstanKenyaKiribatiKorea, Dem. People’s Rep.Korea, Rep.KuwaitKyrgyz RepublicLao PDRLate-demographic dividendLatin America & Caribbean Latin America & Caribbean (excluding high income)Latin America & the Caribbean (IDA & IBRD countries)LatviaLeast developed countries: UN classificationLebanonLesothoLiberiaLibyaLiechtensteinLithuaniaLow & middle incomeLow incomeLower middle incomeLuxembourgMacao SAR, ChinaMacedonia, FYRMadagascarMalawiMaldivesMaliMaltaMarshall IslandsMauritaniaMauritiusMexicoMicronesia, Fed. Sts.Middle East & North AfricaMiddle East & North Africa (excluding high income)Middle East & North Africa (IDA & IBRD countries)Middle incomeMoldovaMongoliaMontenegroMoroccoMozambiqueMyanmarNamibiaNauruNepalNetherlandsNew ZealandNicaraguaNigerNigeriaNorth AmericaNorwayOECD membersOmanOther small statesPacific island small statesPakistanPanamaPapua New GuineaParaguayPeruPhilippinesPolandPortugalPost-demographic dividendPre-demographic dividendPuerto RicoQatarRomaniaRussian FederationRwandaSamoaSan MarinoSao Tome and PrincipeSaudi ArabiaSenegalSerbiaSeychellesSierra LeoneSloveniaSmall statesSolomon IslandsSomaliaSouth AfricaSouth AsiaSouth Asia (IDA & IBRD)South SudanSpainSri LankaSt. Kitts and NevisSt. LuciaSt. Vincent and the GrenadinesSub-Saharan Africa Sub-Saharan Africa (excluding high income)Sub-Saharan Africa (IDA & IBRD countries)SudanSurinameSwazilandSwedenSwitzerlandSyrian Arab RepublicTajikistanTanzaniaThailandTimor-LesteTogoTongaTrinidad and TobagoTunisiaTurkeyTuvaluUgandaUkraineUnited Arab EmiratesUnited KingdomUnited StatesUpper middle incomeUruguayUzbekistanVanuatuVenezuela, RBWest Bank and GazaWorldYemen, Rep.ZambiaZimbabwe línea de tiempo (timeline):
En esta escala de tiempo se presenta un gráfico de 1971 y 2015 de Lower middle income. Los datos de 1970 están ausentes. El número de observaciones reales por fecha: 45.
Fuente (nombre):
Indicadores del desarrollo mundial
Fuente (organización):
United Nations Educational, Scientific, and Cultural Organization (UNESCO) Institute for Statistics.
Categorías:
Education, Gender
Se ha actualizado:
23 abr 2017 año
Los indicadores de los cambios de valor en los últimos años
Mínimo:
50.616
1 ene 1972 año
Máximo:
89.814
1 ene 2013 año
A la fecha de observación
Valor
Cambio absoluto
El cambio con respecto al valor anterior
1 ene 1971 año
50.993
+50.993
0.0%
1 ene 1972 año
50.616
-0.376
-0.74%
1 ene 1973 año
51.99
+1.374
2.71%
1 ene 1974 año
54.376
+2.386
4.59%
1 ene 1975 año
54.162
-0.214
-0.39%
1 ene 1976 año
56.088
+1.926
3.56%
1 ene 1977 año
56.93
+0.842
1.5%
1 ene 1978 año
58.837
+1.907
3.35%
1 ene 1979 año
58.074
-0.763
-1.3%
1 ene 1980 año
59.013
+0.94
1.62%
1 ene 1981 año
60.495
+1.481
2.51%
1 ene 1982 año
62.158
+1.664
2.75%
1 ene 1983 año
64.052
+1.894
3.05%
1 ene 1984 año
65.3
+1.247
1.95%
1 ene 1985 año
66.279
+0.979
1.5%
1 ene 1986 año
66.173
-0.106
-0.16%
1 ene 1987 año
66.669
+0.496
0.75%
1 ene 1988 año
65.941
-0.728
-1.09%
1 ene 1989 año
67.415
+1.474
2.24%
1 ene 1990 año
68.975
+1.56
2.31%
1 ene 1991 año
68.596
-0.378
-0.55%
1 ene 1992 año
69.031
+0.435
0.63%
1 ene 1993 año
69.486
+0.455
0.66%
1 ene 1994 año
71.054
+1.568
2.26%
1 ene 1995 año
72.499
+1.445
2.03%
1 ene 1996 año
72.224
-0.275
-0.38%
1 ene 1997 año
72.543
+0.32
0.44%
1 ene 1998 año
72.974
+0.43
0.59%
1 ene 1999 año
72.941
-0.033
-0.04%
1 ene 2000 año
74.168
+1.226
1.68%
1 ene 2001 año
76.127
+1.959
2.64%
1 ene 2002 año
77.078
+0.952
1.25%
1 ene 2003 año
77.585
+0.507
0.66%
1 ene 2004 año
82.122
+4.537
5.85%
1 ene 2005 año
83.659
+1.537
1.87%
1 ene 2006 año
84.993
+1.334
1.59%
1 ene 2007 año
86.018
+1.026
1.21%
1 ene 2008 año
88.019
+2.001
2.33%
1 ene 2009 año
88.159
+0.14
0.16%
1 ene 2010 año
88.483
+0.324
0.37%
1 ene 2011 año
89.183
+0.699
0.79%
1 ene 2012 año
89.587
+0.404
0.45%
1 ene 2013 año
89.814
+0.227
0.25%
1 ene 2014 año
89.752
-0.062
-0.07%
1 ene 2015 año
89.637
-0.115
-0.13%
Ranking de los países por los datos estadísticos actuales


Comentarios: