29
/es/
es
AIzaSyAYiBZKx7MnpbEhh9jyipgxe19OcubqV5w
April 1, 2024
44009
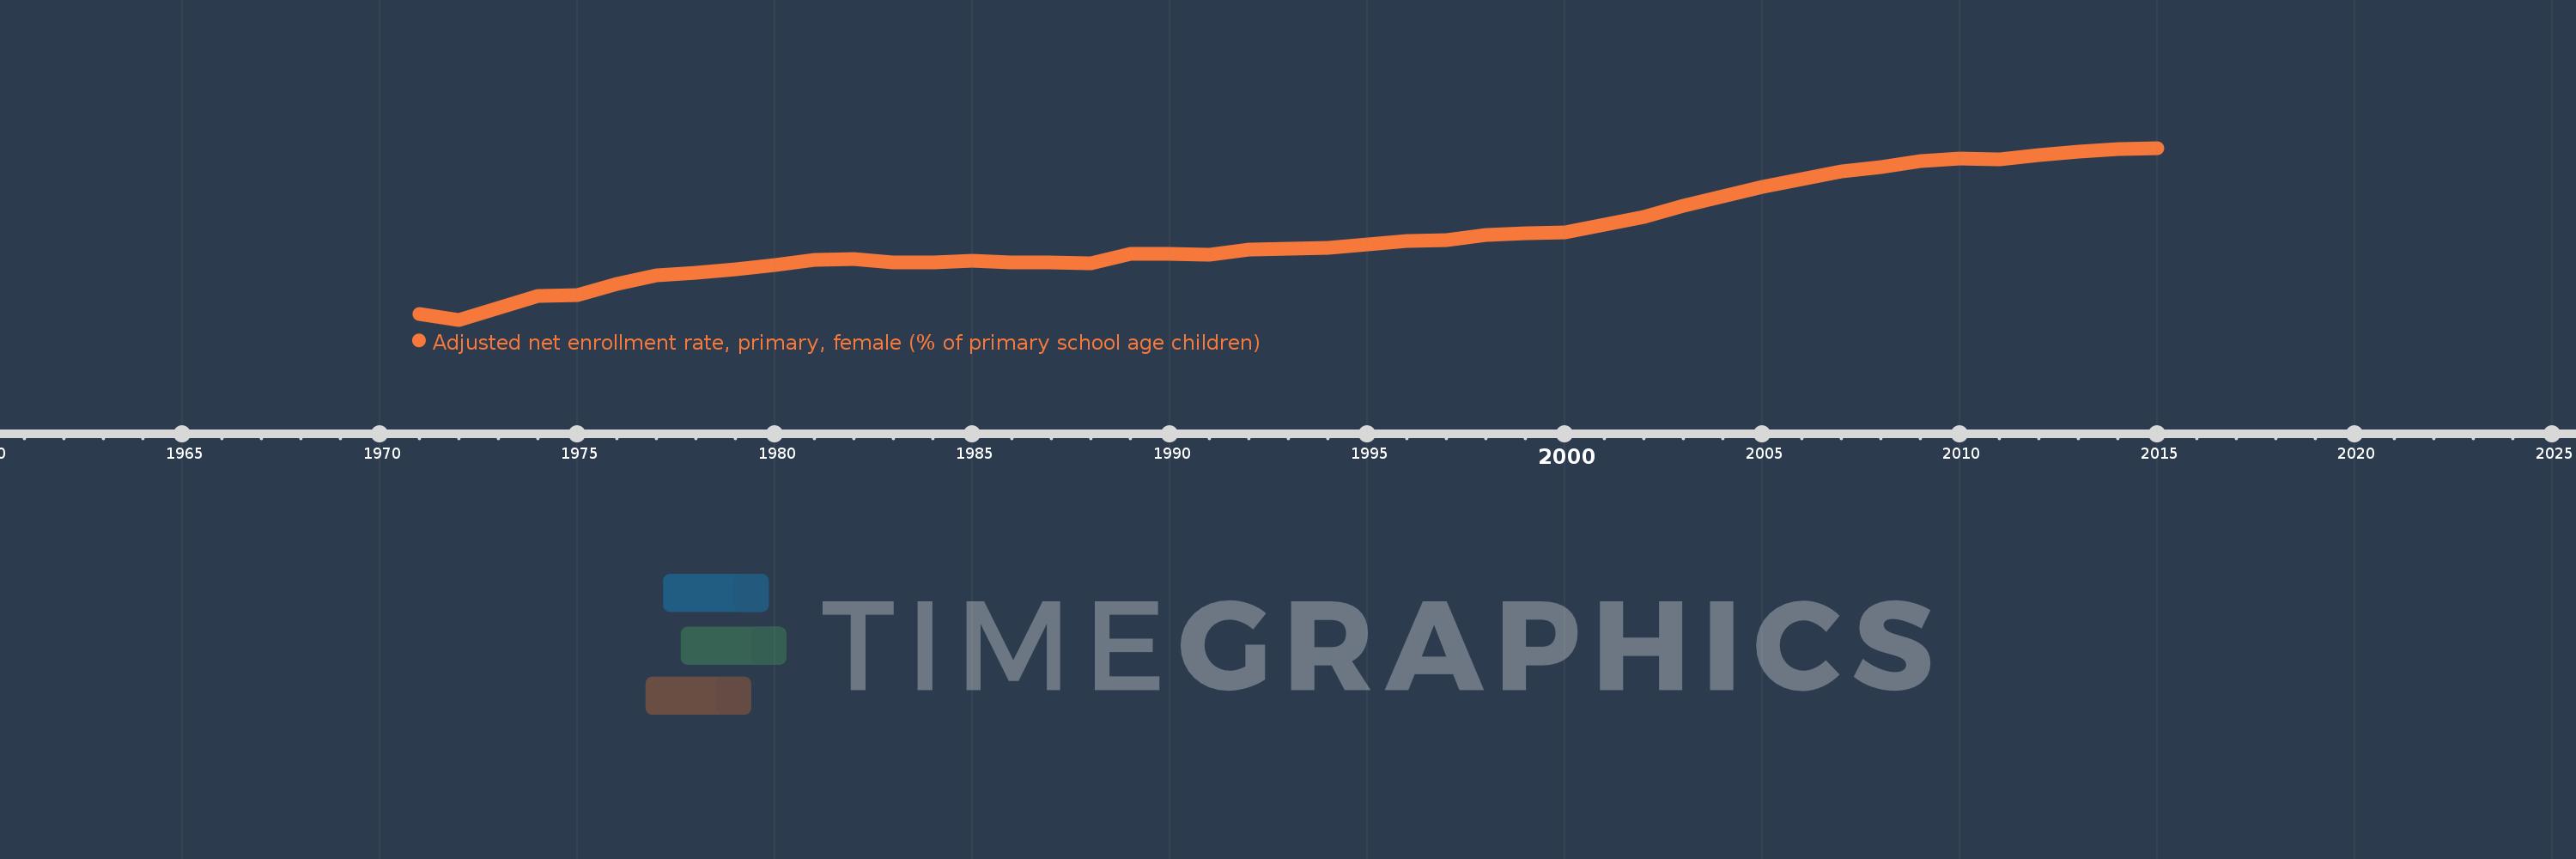
Least developed countries: UN classification
LDC
false
2
1
Adjusted net enrollment rate, primary, female (% of primary school age children)
2015,2014,2013,2012,2011,2010,2009,2008,2007,2006,2005,2004,2003,2002,2001,2000,1999,1998,1997,1996,1995,1994,1993,1992,1991,1990,1989,1988,1987,1986,1985,1984,1983,1982,1981,1980,1979,1978,1977,1976,1975,1974,1973,1972,1971
Estas estadísticas en otros países:
AfghanistanAlbaniaAlgeriaAngolaAntigua and BarbudaArab WorldArgentinaArmeniaArubaAustraliaAustriaAzerbaijanBahamas, TheBahrainBangladeshBarbadosBelarusBelgiumBelizeBeninBermudaBhutanBoliviaBosnia and HerzegovinaBotswanaBrazilBrunei DarussalamBulgariaBurkina FasoBurundiCabo VerdeCambodiaCameroonCanadaCaribbean small statesCentral African RepublicCentral Europe and the BalticsChadChileChinaColombiaComorosCongo, Dem. Rep.Congo, Rep.Costa RicaCote d'IvoireCroatiaCubaCyprusDenmarkDjiboutiDominicaDominican RepublicEarly-demographic dividendEast Asia & PacificEast Asia & Pacific (excluding high income)East Asia & Pacific (IDA & IBRD countries)EcuadorEgypt, Arab Rep.El SalvadorEquatorial GuineaEritreaEstoniaEthiopiaEuro areaEurope & Central AsiaEurope & Central Asia (excluding high income)Europe & Central Asia (IDA & IBRD countries)European UnionFijiFinlandFragile and conflict affected situationsFranceGabonGambia, TheGeorgiaGhanaGreeceGrenadaGuatemalaGuineaGuinea-BissauGuyanaHaitiHeavily indebted poor countries (HIPC)High incomeHondurasHong Kong SAR, ChinaHungaryIBRD onlyIcelandIDA & IBRD totalIDA blendIDA onlyIDA totalIndiaIndonesiaIran, Islamic Rep.IraqIrelandIsraelItalyJamaicaJapanJordanKazakhstanKenyaKiribatiKorea, Dem. People’s Rep.Korea, Rep.KuwaitKyrgyz RepublicLao PDRLate-demographic dividendLatin America & Caribbean Latin America & Caribbean (excluding high income)Latin America & the Caribbean (IDA & IBRD countries)LatviaLeast developed countries: UN classificationLebanonLesothoLiberiaLibyaLiechtensteinLithuaniaLow & middle incomeLow incomeLower middle incomeLuxembourgMacao SAR, ChinaMacedonia, FYRMadagascarMalawiMaldivesMaliMaltaMarshall IslandsMauritaniaMauritiusMexicoMicronesia, Fed. Sts.Middle East & North AfricaMiddle East & North Africa (excluding high income)Middle East & North Africa (IDA & IBRD countries)Middle incomeMoldovaMongoliaMontenegroMoroccoMozambiqueMyanmarNamibiaNauruNepalNetherlandsNew ZealandNicaraguaNigerNigeriaNorth AmericaNorwayOECD membersOmanOther small statesPacific island small statesPakistanPanamaPapua New GuineaParaguayPeruPhilippinesPolandPortugalPost-demographic dividendPre-demographic dividendPuerto RicoQatarRomaniaRussian FederationRwandaSamoaSan MarinoSao Tome and PrincipeSaudi ArabiaSenegalSerbiaSeychellesSierra LeoneSloveniaSmall statesSolomon IslandsSomaliaSouth AfricaSouth AsiaSouth Asia (IDA & IBRD)South SudanSpainSri LankaSt. Kitts and NevisSt. LuciaSt. Vincent and the GrenadinesSub-Saharan Africa Sub-Saharan Africa (excluding high income)Sub-Saharan Africa (IDA & IBRD countries)SudanSurinameSwazilandSwedenSwitzerlandSyrian Arab RepublicTajikistanTanzaniaThailandTimor-LesteTogoTongaTrinidad and TobagoTunisiaTurkeyTuvaluUgandaUkraineUnited Arab EmiratesUnited KingdomUnited StatesUpper middle incomeUruguayUzbekistanVanuatuVenezuela, RBWest Bank and GazaWorldYemen, Rep.ZambiaZimbabwe línea de tiempo (timeline):
En esta escala de tiempo se presenta un gráfico de 1971 y 2015 de Least developed countries: UN classification. Los datos de 1970 están ausentes. El número de observaciones reales por fecha: 45.
Fuente (nombre):
Indicadores del desarrollo mundial
Fuente (organización):
United Nations Educational, Scientific, and Cultural Organization (UNESCO) Institute for Statistics.
Categorías:
Education, Gender
Se ha actualizado:
23 abr 2017 año
Los indicadores de los cambios de valor en los últimos años
Mínimo:
26.244
1 ene 1972 año
Máximo:
80.452
1 ene 2015 año
A la fecha de observación
Valor
Cambio absoluto
El cambio con respecto al valor anterior
1 ene 1971 año
27.961
+27.961
0.0%
1 ene 1972 año
26.244
-1.717
-6.14%
1 ene 1973 año
29.906
+3.662
13.95%
1 ene 1974 año
33.668
+3.762
12.58%
1 ene 1975 año
34.111
+0.443
1.32%
1 ene 1976 año
37.664
+3.553
10.42%
1 ene 1977 año
40.385
+2.721
7.22%
1 ene 1978 año
41.086
+0.7
1.73%
1 ene 1979 año
42.113
+1.027
2.5%
1 ene 1980 año
43.404
+1.292
3.07%
1 ene 1981 año
45.097
+1.693
3.9%
1 ene 1982 año
45.43
+0.333
0.74%
1 ene 1983 año
44.377
-1.053
-2.32%
1 ene 1984 año
44.454
+0.077
0.17%
1 ene 1985 año
44.967
+0.513
1.15%
1 ene 1986 año
44.202
-0.765
-1.7%
1 ene 1987 año
44.421
+0.218
0.49%
1 ene 1988 año
44.104
-0.316
-0.71%
1 ene 1989 año
46.979
+2.874
6.52%
1 ene 1990 año
46.928
-0.051
-0.11%
1 ene 1991 año
46.627
-0.301
-0.64%
1 ene 1992 año
48.342
+1.715
3.68%
1 ene 1993 año
48.677
+0.334
0.69%
1 ene 1994 año
48.979
+0.302
0.62%
1 ene 1995 año
49.995
+1.016
2.07%
1 ene 1996 año
51.227
+1.232
2.46%
1 ene 1997 año
51.321
+0.095
0.18%
1 ene 1998 año
53.025
+1.703
3.32%
1 ene 1999 año
53.647
+0.622
1.17%
1 ene 2000 año
53.926
+0.28
0.52%
1 ene 2001 año
56.251
+2.325
4.31%
1 ene 2002 año
58.583
+2.332
4.15%
1 ene 2003 año
62.126
+3.543
6.05%
1 ene 2004 año
65.168
+3.042
4.9%
1 ene 2005 año
68.044
+2.876
4.41%
1 ene 2006 año
70.514
+2.47
3.63%
1 ene 2007 año
73.072
+2.557
3.63%
1 ene 2008 año
74.414
+1.343
1.84%
1 ene 2009 año
76.221
+1.807
2.43%
1 ene 2010 año
77.11
+0.889
1.17%
1 ene 2011 año
76.737
-0.374
-0.48%
1 ene 2012 año
78.115
+1.378
1.8%
1 ene 2013 año
79.266
+1.151
1.47%
1 ene 2014 año
80.091
+0.825
1.04%
1 ene 2015 año
80.452
+0.361
0.45%
Ranking de los países por los datos estadísticos actuales


Comentarios: