29
/es/
es
AIzaSyAYiBZKx7MnpbEhh9jyipgxe19OcubqV5w
April 1, 2024
36317
IBRD only
IBD
false
2
1
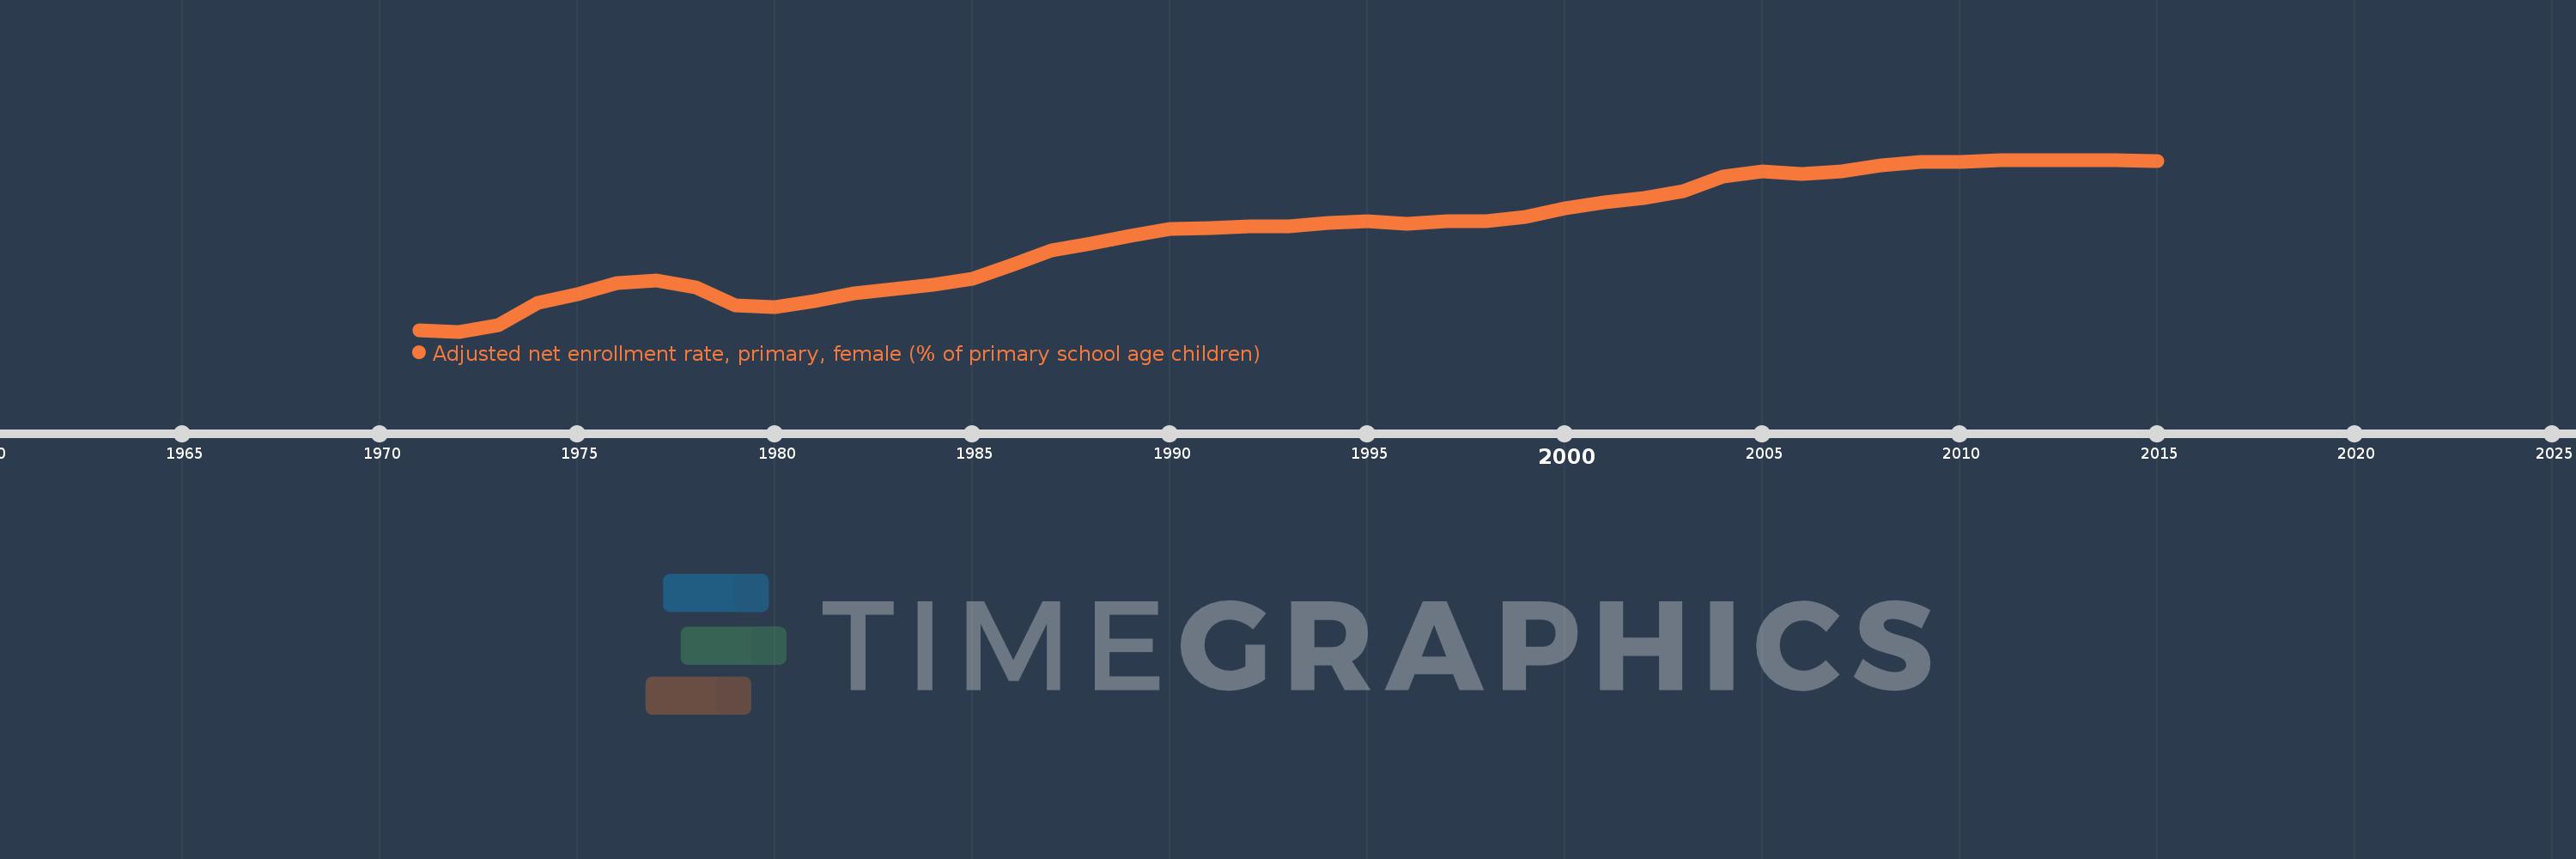
Adjusted net enrollment rate, primary, female (% of primary school age children)
2015,2014,2013,2012,2011,2010,2009,2008,2007,2006,2005,2004,2003,2002,2001,2000,1999,1998,1997,1996,1995,1994,1993,1992,1991,1990,1989,1988,1987,1986,1985,1984,1983,1982,1981,1980,1979,1978,1977,1976,1975,1974,1973,1972,1971
Estas estadísticas en otros países:
AfghanistanAlbaniaAlgeriaAngolaAntigua and BarbudaArab WorldArgentinaArmeniaArubaAustraliaAustriaAzerbaijanBahamas, TheBahrainBangladeshBarbadosBelarusBelgiumBelizeBeninBermudaBhutanBoliviaBosnia and HerzegovinaBotswanaBrazilBrunei DarussalamBulgariaBurkina FasoBurundiCabo VerdeCambodiaCameroonCanadaCaribbean small statesCentral African RepublicCentral Europe and the BalticsChadChileChinaColombiaComorosCongo, Dem. Rep.Congo, Rep.Costa RicaCote d'IvoireCroatiaCubaCyprusDenmarkDjiboutiDominicaDominican RepublicEarly-demographic dividendEast Asia & PacificEast Asia & Pacific (excluding high income)East Asia & Pacific (IDA & IBRD countries)EcuadorEgypt, Arab Rep.El SalvadorEquatorial GuineaEritreaEstoniaEthiopiaEuro areaEurope & Central AsiaEurope & Central Asia (excluding high income)Europe & Central Asia (IDA & IBRD countries)European UnionFijiFinlandFragile and conflict affected situationsFranceGabonGambia, TheGeorgiaGhanaGreeceGrenadaGuatemalaGuineaGuinea-BissauGuyanaHaitiHeavily indebted poor countries (HIPC)High incomeHondurasHong Kong SAR, ChinaHungaryIBRD onlyIcelandIDA & IBRD totalIDA blendIDA onlyIDA totalIndiaIndonesiaIran, Islamic Rep.IraqIrelandIsraelItalyJamaicaJapanJordanKazakhstanKenyaKiribatiKorea, Dem. People’s Rep.Korea, Rep.KuwaitKyrgyz RepublicLao PDRLate-demographic dividendLatin America & Caribbean Latin America & Caribbean (excluding high income)Latin America & the Caribbean (IDA & IBRD countries)LatviaLeast developed countries: UN classificationLebanonLesothoLiberiaLibyaLiechtensteinLithuaniaLow & middle incomeLow incomeLower middle incomeLuxembourgMacao SAR, ChinaMacedonia, FYRMadagascarMalawiMaldivesMaliMaltaMarshall IslandsMauritaniaMauritiusMexicoMicronesia, Fed. Sts.Middle East & North AfricaMiddle East & North Africa (excluding high income)Middle East & North Africa (IDA & IBRD countries)Middle incomeMoldovaMongoliaMontenegroMoroccoMozambiqueMyanmarNamibiaNauruNepalNetherlandsNew ZealandNicaraguaNigerNigeriaNorth AmericaNorwayOECD membersOmanOther small statesPacific island small statesPakistanPanamaPapua New GuineaParaguayPeruPhilippinesPolandPortugalPost-demographic dividendPre-demographic dividendPuerto RicoQatarRomaniaRussian FederationRwandaSamoaSan MarinoSao Tome and PrincipeSaudi ArabiaSenegalSerbiaSeychellesSierra LeoneSloveniaSmall statesSolomon IslandsSomaliaSouth AfricaSouth AsiaSouth Asia (IDA & IBRD)South SudanSpainSri LankaSt. Kitts and NevisSt. LuciaSt. Vincent and the GrenadinesSub-Saharan Africa Sub-Saharan Africa (excluding high income)Sub-Saharan Africa (IDA & IBRD countries)SudanSurinameSwazilandSwedenSwitzerlandSyrian Arab RepublicTajikistanTanzaniaThailandTimor-LesteTogoTongaTrinidad and TobagoTunisiaTurkeyTuvaluUgandaUkraineUnited Arab EmiratesUnited KingdomUnited StatesUpper middle incomeUruguayUzbekistanVanuatuVenezuela, RBWest Bank and GazaWorldYemen, Rep.ZambiaZimbabwe línea de tiempo (timeline):
En esta escala de tiempo se presenta un gráfico de 1971 y 2015 de IBRD only. Los datos de 1970 están ausentes. El número de observaciones reales por fecha: 45.
Fuente (nombre):
Indicadores del desarrollo mundial
Fuente (organización):
United Nations Educational, Scientific, and Cultural Organization (UNESCO) Institute for Statistics.
Categorías:
Education, Gender
Se ha actualizado:
23 abr 2017 año
Los indicadores de los cambios de valor en los últimos años
Mínimo:
65.07
1 ene 1972 año
Máximo:
96.415
1 ene 2013 año
A la fecha de observación
Valor
Cambio absoluto
El cambio con respecto al valor anterior
1 ene 1971 año
65.369
+65.369
0.0%
1 ene 1972 año
65.07
-0.299
-0.46%
1 ene 1973 año
66.209
+1.139
1.75%
1 ene 1974 año
70.346
+4.137
6.25%
1 ene 1975 año
71.9
+1.554
2.21%
1 ene 1976 año
73.888
+1.988
2.76%
1 ene 1977 año
74.417
+0.53
0.72%
1 ene 1978 año
73.064
-1.353
-1.82%
1 ene 1979 año
69.809
-3.256
-4.46%
1 ene 1980 año
69.578
-0.23
-0.33%
1 ene 1981 año
70.61
+1.032
1.48%
1 ene 1982 año
71.986
+1.376
1.95%
1 ene 1983 año
72.795
+0.809
1.12%
1 ene 1984 año
73.655
+0.86
1.18%
1 ene 1985 año
74.781
+1.126
1.53%
1 ene 1986 año
77.188
+2.408
3.22%
1 ene 1987 año
79.89
+2.702
3.5%
1 ene 1988 año
81.159
+1.269
1.59%
1 ene 1989 año
82.528
+1.369
1.69%
1 ene 1990 año
83.841
+1.313
1.59%
1 ene 1991 año
83.942
+0.101
0.12%
1 ene 1992 año
84.309
+0.366
0.44%
1 ene 1993 año
84.283
-0.026
-0.03%
1 ene 1994 año
84.839
+0.557
0.66%
1 ene 1995 año
85.272
+0.433
0.51%
1 ene 1996 año
84.816
-0.456
-0.53%
1 ene 1997 año
85.187
+0.371
0.44%
1 ene 1998 año
85.192
+0.004
0.01%
1 ene 1999 año
86.055
+0.864
1.01%
1 ene 2000 año
87.626
+1.57
1.82%
1 ene 2001 año
88.701
+1.075
1.23%
1 ene 2002 año
89.374
+0.673
0.76%
1 ene 2003 año
90.748
+1.374
1.54%
1 ene 2004 año
93.355
+2.607
2.87%
1 ene 2005 año
94.247
+0.892
0.96%
1 ene 2006 año
93.831
-0.417
-0.44%
1 ene 2007 año
94.227
+0.396
0.42%
1 ene 2008 año
95.38
+1.153
1.22%
1 ene 2009 año
96.078
+0.698
0.73%
1 ene 2010 año
96.012
-0.066
-0.07%
1 ene 2011 año
96.346
+0.335
0.35%
1 ene 2012 año
96.408
+0.061
0.06%
1 ene 2013 año
96.415
+0.007
0.01%
1 ene 2014 año
96.305
-0.11
-0.11%
1 ene 2015 año
96.173
-0.132
-0.14%
Ranking de los países por los datos estadísticos actuales


Comentarios: