29
/es/
es
AIzaSyAYiBZKx7MnpbEhh9jyipgxe19OcubqV5w
April 1, 2024
42455
Latin America & Caribbean (excluding high income)
LAC
false
2
1
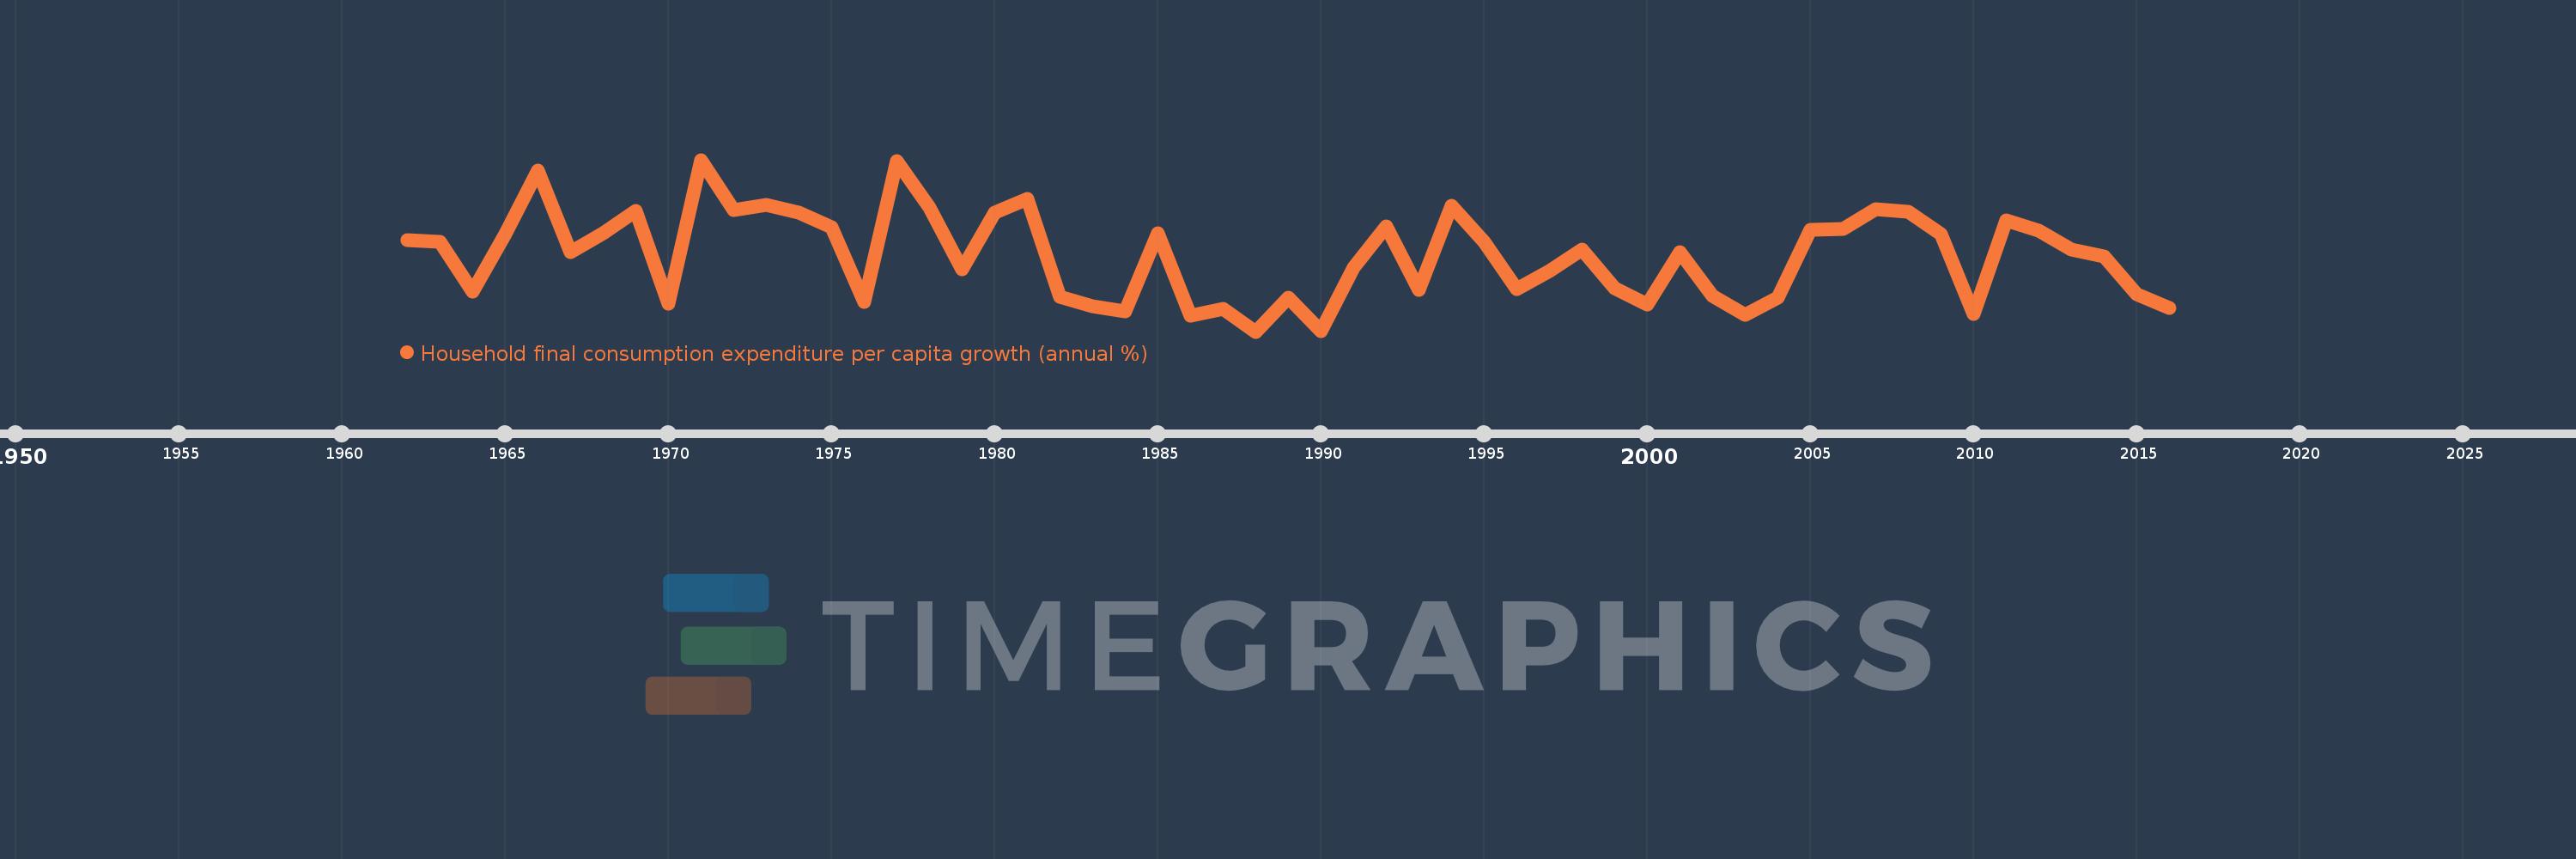
Household final consumption expenditure per capita growth (annual %)
2016,2015,2014,2013,2012,2011,2010,2009,2008,2007,2006,2005,2004,2003,2002,2001,2000,1999,1998,1997,1996,1995,1994,1993,1992,1991,1990,1989,1988,1987,1986,1985,1984,1983,1982,1981,1980,1979,1978,1977,1976,1975,1974,1973,1972,1971,1970,1969,1968,1967,1966,1965,1964,1963,1962
Estas estadísticas en otros países:
AlbaniaAlgeriaAntigua and BarbudaArab WorldArgentinaArmeniaAustraliaAustriaAzerbaijanBahamas, TheBahrainBangladeshBarbadosBelarusBelgiumBelizeBeninBhutanBoliviaBosnia and HerzegovinaBotswanaBrazilBrunei DarussalamBulgariaBurkina FasoBurundiCabo VerdeCambodiaCameroonCanadaCaribbean small statesCentral Europe and the BalticsChadChileChinaColombiaComorosCongo, Dem. Rep.Congo, Rep.Costa RicaCote d'IvoireCroatiaCubaCyprusCzech RepublicDenmarkDominican RepublicEarly-demographic dividendEast Asia & PacificEast Asia & Pacific (excluding high income)East Asia & Pacific (IDA & IBRD countries)EcuadorEgypt, Arab Rep.El SalvadorEquatorial GuineaEritreaEstoniaEuro areaEurope & Central AsiaEurope & Central Asia (excluding high income)Europe & Central Asia (IDA & IBRD countries)European UnionFinlandFranceGabonGambia, TheGermanyGhanaGreeceGuatemalaGuineaGuinea-BissauHaitiHeavily indebted poor countries (HIPC)High incomeHondurasHong Kong SAR, ChinaHungaryIBRD onlyIcelandIDA & IBRD totalIDA blendIDA onlyIDA totalIndiaIndonesiaIran, Islamic Rep.IrelandIsraelItalyJamaicaJapanJordanKazakhstanKenyaKorea, Rep.KosovoKuwaitKyrgyz RepublicLate-demographic dividendLatin America & Caribbean Latin America & Caribbean (excluding high income)Latin America & the Caribbean (IDA & IBRD countries)LatviaLeast developed countries: UN classificationLebanonLiberiaLithuaniaLow & middle incomeLow incomeLower middle incomeLuxembourgMacao SAR, ChinaMacedonia, FYRMadagascarMalawiMalaysiaMaliMaltaMauritaniaMauritiusMexicoMiddle East & North AfricaMiddle East & North Africa (excluding high income)Middle East & North Africa (IDA & IBRD countries)Middle incomeMoldovaMongoliaMontenegroMoroccoMozambiqueNamibiaNepalNetherlandsNew ZealandNicaraguaNigerNigeriaNorth AmericaNorwayOECD membersOmanOther small statesPakistanPanamaParaguayPeruPhilippinesPolandPortugalPost-demographic dividendPre-demographic dividendPuerto RicoQatarRomaniaRussian FederationRwandaSaudi ArabiaSenegalSerbiaSierra LeoneSingaporeSlovak RepublicSloveniaSmall statesSouth AfricaSouth AsiaSouth Asia (IDA & IBRD)South SudanSpainSri LankaSub-Saharan Africa Sub-Saharan Africa (excluding high income)Sub-Saharan Africa (IDA & IBRD countries)SudanSurinameSwazilandSwedenSwitzerlandTajikistanTanzaniaThailandTimor-LesteTogoTrinidad and TobagoTunisiaTurkeyUgandaUkraineUnited Arab EmiratesUnited KingdomUnited StatesUpper middle incomeUruguayVanuatuVenezuela, RBVietnamWest Bank and GazaWorldZimbabwe línea de tiempo (timeline):
En esta escala de tiempo se presenta un gráfico de 1962 y 2016 de Latin America & Caribbean (excluding high income). Los datos de 1961 están ausentes. El número de observaciones reales por fecha: 55.
Fuente (nombre):
Indicadores del desarrollo mundial
Fuente (organización):
World Bank national accounts data, and OECD National Accounts data files.
Categorías:
Economy & Growth
Se ha actualizado:
23 abr 2017 año
Los indicadores de los cambios de valor en los últimos años
Mínimo:
-2.638
1 ene 1988 año
Máximo:
8.513
1 ene 1971 año
A la fecha de observación
Valor
Cambio absoluto
El cambio con respecto al valor anterior
1 ene 1962 año
3.279
+3.279
0.0%
1 ene 1963 año
3.161
-0.118
-3.6%
1 ene 1964 año
-0.06
-3.222
-101.91%
1 ene 1965 año
3.696
+3.757
-6.21 mil%
1 ene 1966 año
7.822
+4.126
111.62%
1 ene 1967 año
2.528
-5.294
-67.68%
1 ene 1968 año
3.725
+1.197
47.35%
1 ene 1969 año
5.181
+1.456
39.08%
1 ene 1970 año
-0.832
-6.014
-116.06%
1 ene 1971 año
8.513
+9.346
-1.12 mil%
1 ene 1972 año
5.232
-3.281
-38.54%
1 ene 1973 año
5.612
+0.379
7.25%
1 ene 1974 año
5.084
-0.528
-9.41%
1 ene 1975 año
4.122
-0.962
-18.92%
1 ene 1976 año
-0.73
-4.852
-117.71%
1 ene 1977 año
8.425
+9.155
-1.25 mil%
1 ene 1978 año
5.414
-3.011
-35.74%
1 ene 1979 año
1.402
-4.011
-74.1%
1 ene 1980 año
5.103
+3.701
263.93%
1 ene 1981 año
6.003
+0.9
17.64%
1 ene 1982 año
-0.364
-6.368
-106.07%
1 ene 1983 año
-1.016
-0.652
178.86%
1 ene 1984 año
-1.332
-0.316
31.11%
1 ene 1985 año
3.737
+5.069
-380.51%
1 ene 1986 año
-1.622
-5.358
-143.4%
1 ene 1987 año
-1.151
+0.471
-29.02%
1 ene 1988 año
-2.638
-1.487
129.19%
1 ene 1989 año
-0.448
+2.19
-83.02%
1 ene 1990 año
-2.626
-2.178
486.36%
1 ene 1991 año
1.523
+4.149
-158.01%
1 ene 1992 año
4.191
+2.667
175.09%
1 ene 1993 año
0.072
-4.119
-98.27%
1 ene 1994 año
5.546
+5.474
7.57 mil%
1 ene 1995 año
3.206
-2.34
-42.19%
1 ene 1996 año
0.114
-3.093
-96.46%
1 ene 1997 año
1.265
+1.151
1.01 mil%
1 ene 1998 año
2.683
+1.418
112.11%
1 ene 1999 año
0.185
-2.497
-93.09%
1 ene 2000 año
-0.866
-1.052
-566.96%
1 ene 2001 año
2.514
+3.38
-390.32%
1 ene 2002 año
-0.332
-2.846
-113.19%
1 ene 2003 año
-1.571
-1.24
373.7%
1 ene 2004 año
-0.454
+1.118
-71.12%
1 ene 2005 año
3.957
+4.411
-971.89%
1 ene 2006 año
4.038
+0.081
2.05%
1 ene 2007 año
5.285
+1.247
30.88%
1 ene 2008 año
5.167
-0.118
-2.22%
1 ene 2009 año
3.678
-1.489
-28.82%
1 ene 2010 año
-1.499
-5.177
-140.74%
1 ene 2011 año
4.558
+6.057
-404.18%
1 ene 2012 año
3.888
-0.671
-14.71%
1 ene 2013 año
2.664
-1.224
-31.49%
1 ene 2014 año
2.237
-0.427
-16.02%
1 ene 2015 año
-0.208
-2.445
-109.29%
1 ene 2016 año
-1.084
-0.876
421.19%
Ranking de los países por los datos estadísticos actuales


Comentarios: