29
/es/
es
AIzaSyAYiBZKx7MnpbEhh9jyipgxe19OcubqV5w
April 1, 2024
281075
Venezuela, RB
VEN
true
2
1
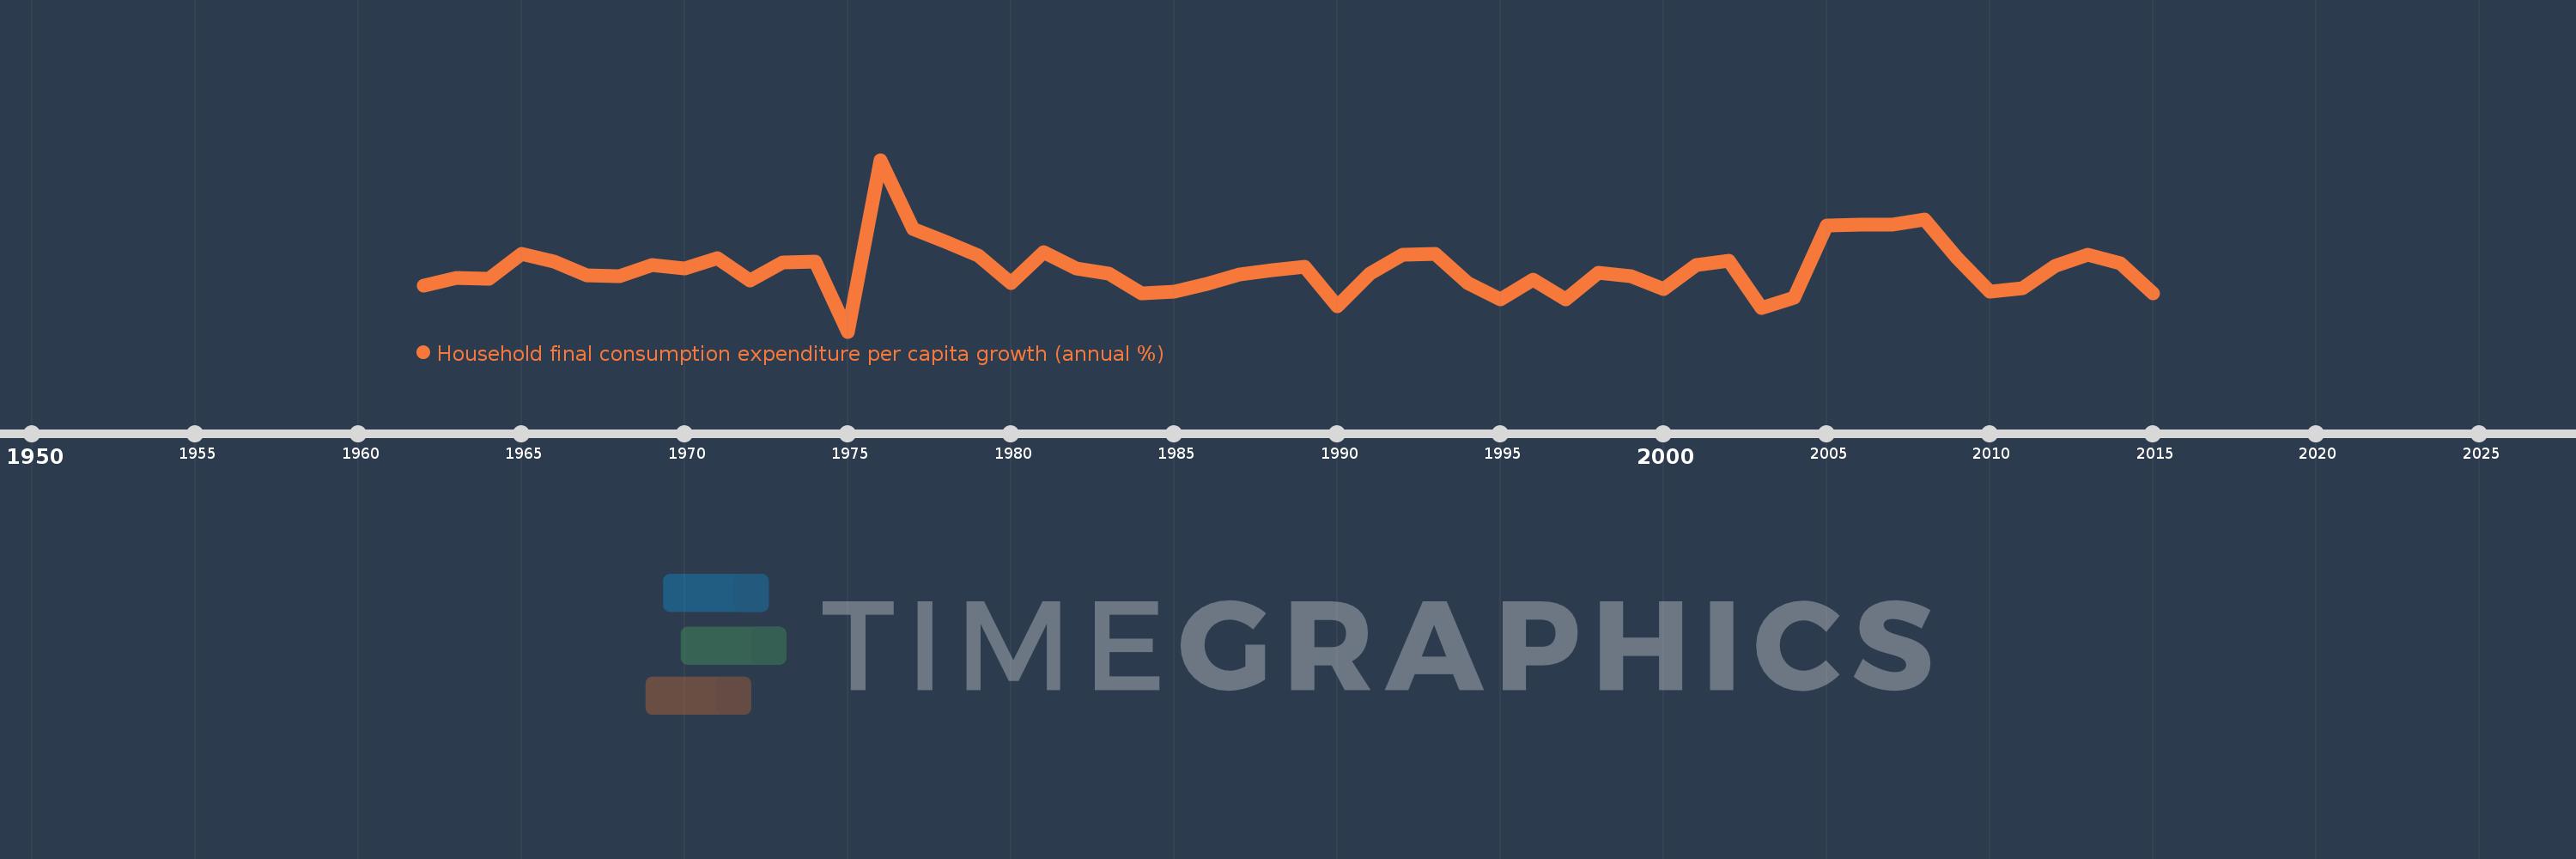
Household final consumption expenditure per capita growth (annual %)
2015,2014,2013,2012,2011,2010,2009,2008,2007,2006,2005,2004,2003,2002,2001,2000,1999,1998,1997,1996,1995,1994,1993,1992,1991,1990,1989,1988,1987,1986,1985,1984,1983,1982,1981,1980,1979,1978,1977,1976,1975,1974,1973,1972,1971,1970,1969,1968,1967,1966,1965,1964,1963,1962
Estas estadísticas en otros países:
AlbaniaAlgeriaAntigua and BarbudaArab WorldArgentinaArmeniaAustraliaAustriaAzerbaijanBahamas, TheBahrainBangladeshBarbadosBelarusBelgiumBelizeBeninBhutanBoliviaBosnia and HerzegovinaBotswanaBrazilBrunei DarussalamBulgariaBurkina FasoBurundiCabo VerdeCambodiaCameroonCanadaCaribbean small statesCentral Europe and the BalticsChadChileChinaColombiaComorosCongo, Dem. Rep.Congo, Rep.Costa RicaCote d'IvoireCroatiaCubaCyprusCzech RepublicDenmarkDominican RepublicEarly-demographic dividendEast Asia & PacificEast Asia & Pacific (excluding high income)East Asia & Pacific (IDA & IBRD countries)EcuadorEgypt, Arab Rep.El SalvadorEquatorial GuineaEritreaEstoniaEuro areaEurope & Central AsiaEurope & Central Asia (excluding high income)Europe & Central Asia (IDA & IBRD countries)European UnionFinlandFranceGabonGambia, TheGermanyGhanaGreeceGuatemalaGuineaGuinea-BissauHaitiHeavily indebted poor countries (HIPC)High incomeHondurasHong Kong SAR, ChinaHungaryIBRD onlyIcelandIDA & IBRD totalIDA blendIDA onlyIDA totalIndiaIndonesiaIran, Islamic Rep.IrelandIsraelItalyJamaicaJapanJordanKazakhstanKenyaKorea, Rep.KosovoKuwaitKyrgyz RepublicLate-demographic dividendLatin America & Caribbean Latin America & Caribbean (excluding high income)Latin America & the Caribbean (IDA & IBRD countries)LatviaLeast developed countries: UN classificationLebanonLiberiaLithuaniaLow & middle incomeLow incomeLower middle incomeLuxembourgMacao SAR, ChinaMacedonia, FYRMadagascarMalawiMalaysiaMaliMaltaMauritaniaMauritiusMexicoMiddle East & North AfricaMiddle East & North Africa (excluding high income)Middle East & North Africa (IDA & IBRD countries)Middle incomeMoldovaMongoliaMontenegroMoroccoMozambiqueNamibiaNepalNetherlandsNew ZealandNicaraguaNigerNigeriaNorth AmericaNorwayOECD membersOmanOther small statesPakistanPanamaParaguayPeruPhilippinesPolandPortugalPost-demographic dividendPre-demographic dividendPuerto RicoQatarRomaniaRussian FederationRwandaSaudi ArabiaSenegalSerbiaSierra LeoneSingaporeSlovak RepublicSloveniaSmall statesSouth AfricaSouth AsiaSouth Asia (IDA & IBRD)South SudanSpainSri LankaSub-Saharan Africa Sub-Saharan Africa (excluding high income)Sub-Saharan Africa (IDA & IBRD countries)SudanSurinameSwazilandSwedenSwitzerlandTajikistanTanzaniaThailandTimor-LesteTogoTrinidad and TobagoTunisiaTurkeyUgandaUkraineUnited Arab EmiratesUnited KingdomUnited StatesUpper middle incomeUruguayVanuatuVenezuela, RBVietnamWest Bank and GazaWorldZimbabwe línea de tiempo (timeline):
En esta escala de tiempo se presenta un gráfico de 1962 y 2015 de Venezuela, RB. Los datos de 1961 están ausentes. El número de observaciones reales por fecha: 54.
Fuente (nombre):
Indicadores del desarrollo mundial
Fuente (organización):
World Bank national accounts data, and OECD National Accounts data files.
Categorías:
Economy & Growth
Se ha actualizado:
23 abr 2017 año
Los indicadores de los cambios de valor en los últimos años
Mínimo:
-15.02
1 ene 1975 año
Máximo:
31.01
1 ene 1976 año
A la fecha de observación
Valor
Cambio absoluto
El cambio con respecto al valor anterior
1 ene 1962 año
-2.806
-2.806
0.0%
1 ene 1963 año
-0.742
+2.064
-73.56%
1 ene 1964 año
-0.812
-0.07
9.39%
1 ene 1965 año
5.864
+6.675
-822.58%
1 ene 1966 año
3.684
-2.18
-37.17%
1 ene 1967 año
-0.036
-3.72
-100.99%
1 ene 1968 año
-0.174
-0.138
379.17%
1 ene 1969 año
2.897
+3.071
-1.77 mil%
1 ene 1970 año
1.893
-1.005
-34.68%
1 ene 1971 año
4.678
+2.785
147.17%
1 ene 1972 año
-1.435
-6.113
-130.68%
1 ene 1973 año
3.404
+4.839
-337.17%
1 ene 1974 año
3.659
+0.255
7.48%
1 ene 1975 año
-15.02
-18.679
-510.53%
1 ene 1976 año
31.01
+46.03
-306.45%
1 ene 1977 año
12.513
-18.497
-59.65%
1 ene 1978 año
9.024
-3.489
-27.88%
1 ene 1979 año
5.372
-3.652
-40.47%
1 ene 1980 año
-2.112
-7.484
-139.31%
1 ene 1981 año
6.266
+8.378
-396.74%
1 ene 1982 año
1.883
-4.383
-69.95%
1 ene 1983 año
0.545
-1.338
-71.03%
1 ene 1984 año
-4.714
-5.259
-964.21%
1 ene 1985 año
-4.326
+0.388
-8.22%
1 ene 1986 año
-2.332
+1.994
-46.1%
1 ene 1987 año
0.324
+2.656
-113.88%
1 ene 1988 año
1.345
+1.021
315.4%
1 ene 1989 año
2.409
+1.064
79.14%
1 ene 1990 año
-8.266
-10.676
-443.09%
1 ene 1991 año
0.415
+8.682
-105.02%
1 ene 1992 año
5.479
+5.063
1.22 mil%
1 ene 1993 año
5.886
+0.408
7.44%
1 ene 1994 año
-2.083
-7.97
-135.39%
1 ene 1995 año
-6.487
-4.404
211.37%
1 ene 1996 año
-1.159
+5.329
-82.14%
1 ene 1997 año
-6.349
-5.19
447.98%
1 ene 1998 año
0.649
+6.998
-110.22%
1 ene 1999 año
-0.141
-0.79
-121.69%
1 ene 2000 año
-3.578
-3.437
2.44 mil%
1 ene 2001 año
2.726
+6.303
-176.18%
1 ene 2002 año
4.04
+1.314
48.22%
1 ene 2003 año
-8.786
-12.826
-317.48%
1 ene 2004 año
-5.96
+2.826
-32.17%
1 ene 2005 año
13.443
+19.403
-325.55%
1 ene 2006 año
13.747
+0.304
2.26%
1 ene 2007 año
13.54
-0.208
-1.51%
1 ene 2008 año
14.988
+1.448
10.69%
1 ene 2009 año
4.63
-10.357
-69.11%
1 ene 2010 año
-4.426
-9.056
-195.58%
1 ene 2011 año
-3.348
+1.078
-24.36%
1 ene 2012 año
2.497
+5.845
-174.6%
1 ene 2013 año
5.494
+2.997
120.03%
1 ene 2014 año
3.264
-2.231
-40.6%
1 ene 2015 año
-4.678
-7.941
-243.32%
Ranking de los países por los datos estadísticos actuales


Comentarios: