29
/es/
es
AIzaSyAYiBZKx7MnpbEhh9jyipgxe19OcubqV5w
April 1, 2024
156087
Indonesia
IDN
true
2
1
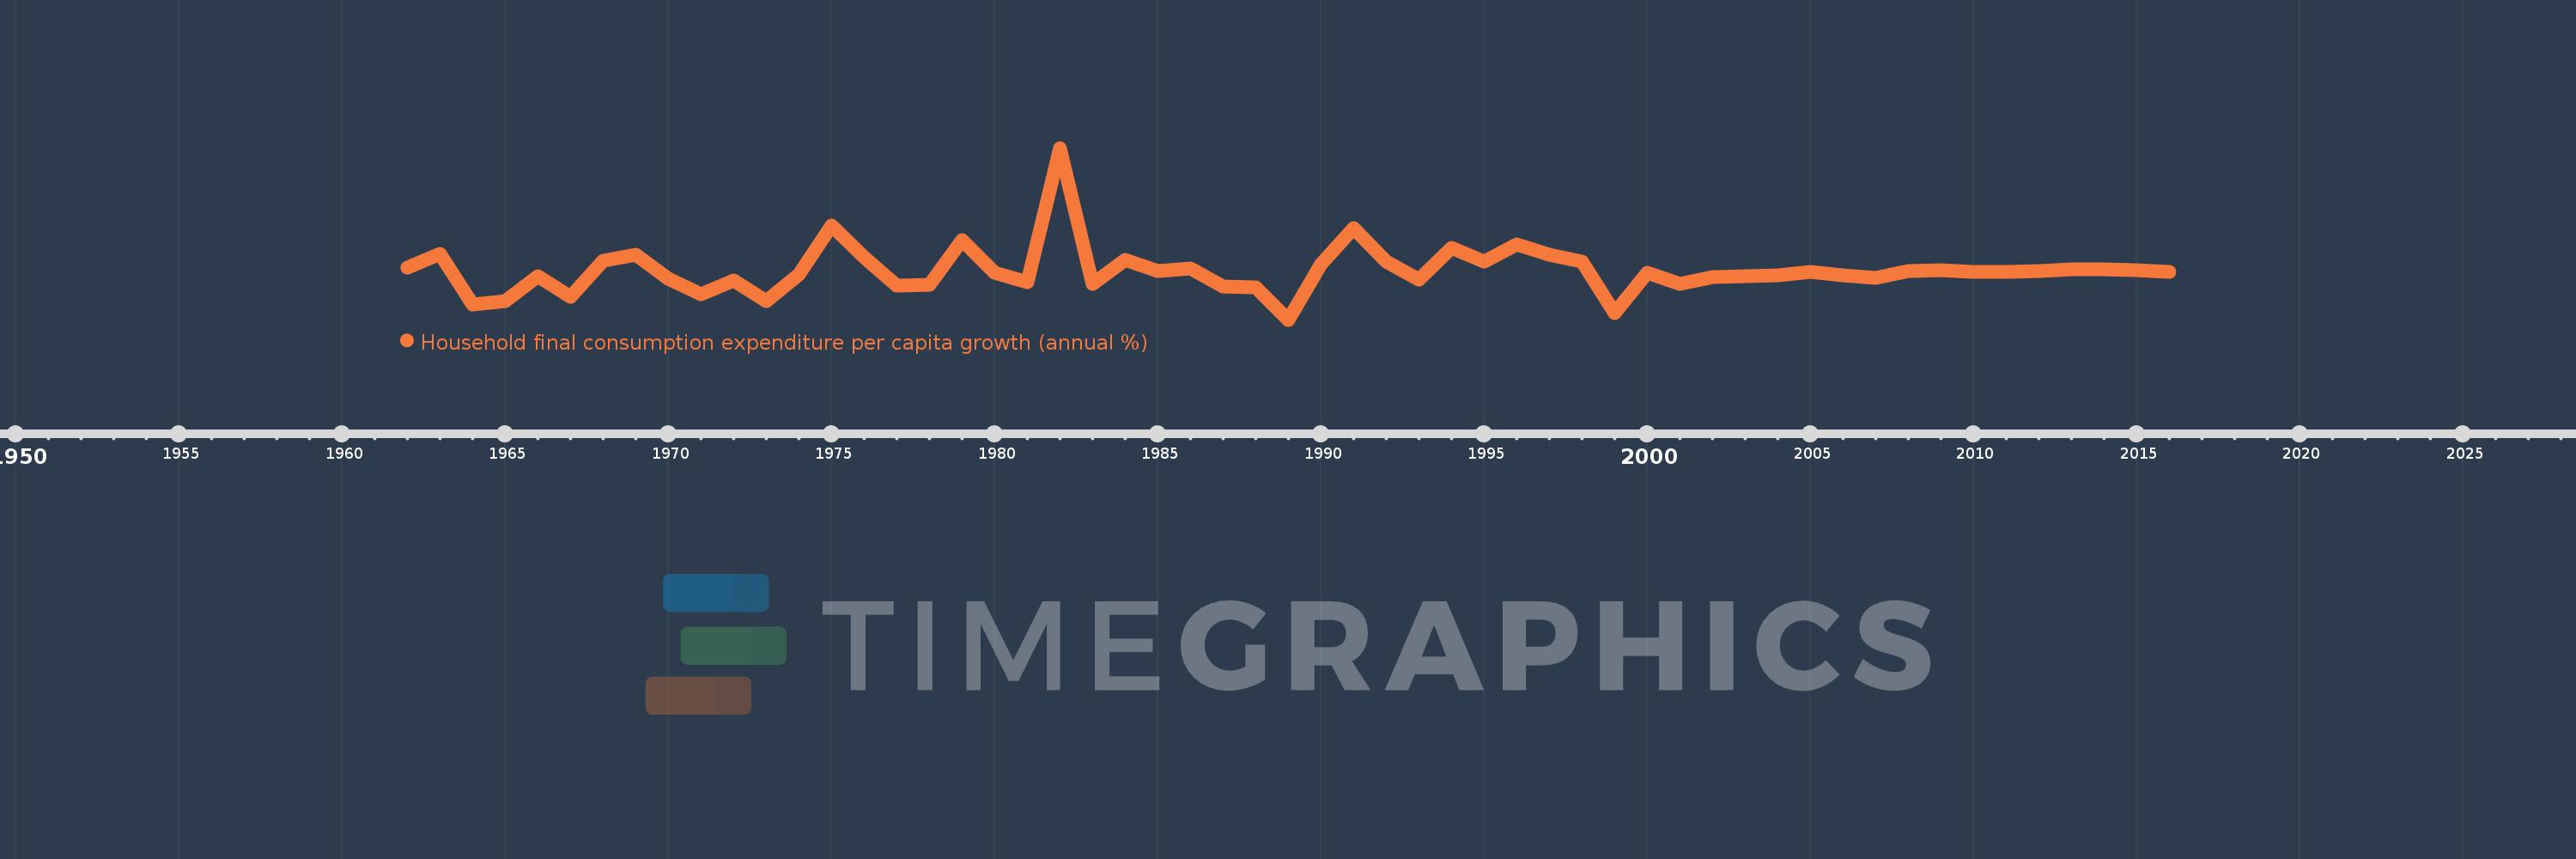
Household final consumption expenditure per capita growth (annual %)
2016,2015,2014,2013,2012,2011,2010,2009,2008,2007,2006,2005,2004,2003,2002,2001,2000,1999,1998,1997,1996,1995,1994,1993,1992,1991,1990,1989,1988,1987,1986,1985,1984,1983,1982,1981,1980,1979,1978,1977,1976,1975,1974,1973,1972,1971,1970,1969,1968,1967,1966,1965,1964,1963,1962
Estas estadísticas en otros países:
AlbaniaAlgeriaAntigua and BarbudaArab WorldArgentinaArmeniaAustraliaAustriaAzerbaijanBahamas, TheBahrainBangladeshBarbadosBelarusBelgiumBelizeBeninBhutanBoliviaBosnia and HerzegovinaBotswanaBrazilBrunei DarussalamBulgariaBurkina FasoBurundiCabo VerdeCambodiaCameroonCanadaCaribbean small statesCentral Europe and the BalticsChadChileChinaColombiaComorosCongo, Dem. Rep.Congo, Rep.Costa RicaCote d'IvoireCroatiaCubaCyprusCzech RepublicDenmarkDominican RepublicEarly-demographic dividendEast Asia & PacificEast Asia & Pacific (excluding high income)East Asia & Pacific (IDA & IBRD countries)EcuadorEgypt, Arab Rep.El SalvadorEquatorial GuineaEritreaEstoniaEuro areaEurope & Central AsiaEurope & Central Asia (excluding high income)Europe & Central Asia (IDA & IBRD countries)European UnionFinlandFranceGabonGambia, TheGermanyGhanaGreeceGuatemalaGuineaGuinea-BissauHaitiHeavily indebted poor countries (HIPC)High incomeHondurasHong Kong SAR, ChinaHungaryIBRD onlyIcelandIDA & IBRD totalIDA blendIDA onlyIDA totalIndiaIndonesiaIran, Islamic Rep.IrelandIsraelItalyJamaicaJapanJordanKazakhstanKenyaKorea, Rep.KosovoKuwaitKyrgyz RepublicLate-demographic dividendLatin America & Caribbean Latin America & Caribbean (excluding high income)Latin America & the Caribbean (IDA & IBRD countries)LatviaLeast developed countries: UN classificationLebanonLiberiaLithuaniaLow & middle incomeLow incomeLower middle incomeLuxembourgMacao SAR, ChinaMacedonia, FYRMadagascarMalawiMalaysiaMaliMaltaMauritaniaMauritiusMexicoMiddle East & North AfricaMiddle East & North Africa (excluding high income)Middle East & North Africa (IDA & IBRD countries)Middle incomeMoldovaMongoliaMontenegroMoroccoMozambiqueNamibiaNepalNetherlandsNew ZealandNicaraguaNigerNigeriaNorth AmericaNorwayOECD membersOmanOther small statesPakistanPanamaParaguayPeruPhilippinesPolandPortugalPost-demographic dividendPre-demographic dividendPuerto RicoQatarRomaniaRussian FederationRwandaSaudi ArabiaSenegalSerbiaSierra LeoneSingaporeSlovak RepublicSloveniaSmall statesSouth AfricaSouth AsiaSouth Asia (IDA & IBRD)South SudanSpainSri LankaSub-Saharan Africa Sub-Saharan Africa (excluding high income)Sub-Saharan Africa (IDA & IBRD countries)SudanSurinameSwazilandSwedenSwitzerlandTajikistanTanzaniaThailandTimor-LesteTogoTrinidad and TobagoTunisiaTurkeyUgandaUkraineUnited Arab EmiratesUnited KingdomUnited StatesUpper middle incomeUruguayVanuatuVenezuela, RBVietnamWest Bank and GazaWorldZimbabwe línea de tiempo (timeline):
En esta escala de tiempo se presenta un gráfico de 1962 y 2016 de Indonesia. Los datos de 1961 están ausentes. El número de observaciones reales por fecha: 55.
Fuente (nombre):
Indicadores del desarrollo mundial
Fuente (organización):
World Bank national accounts data, and OECD National Accounts data files.
Categorías:
Economy & Growth
Se ha actualizado:
23 abr 2017 año
Los indicadores de los cambios de valor en los últimos años
Mínimo:
-9.209
1 ene 1989 año
Máximo:
36.379
1 ene 1982 año
A la fecha de observación
Valor
Cambio absoluto
El cambio con respecto al valor anterior
1 ene 1962 año
4.541
+4.541
0.0%
1 ene 1963 año
8.209
+3.668
80.78%
1 ene 1964 año
-5.197
-13.407
-163.31%
1 ene 1965 año
-4.376
+0.822
-15.81%
1 ene 1966 año
2.302
+6.677
-152.6%
1 ene 1967 año
-3.189
-5.491
-238.55%
1 ene 1968 año
6.533
+9.722
-304.85%
1 ene 1969 año
8.076
+1.543
23.62%
1 ene 1970 año
1.759
-6.317
-78.22%
1 ene 1971 año
-2.468
-4.227
-240.33%
1 ene 1972 año
1.22
+3.688
-149.45%
1 ene 1973 año
-4.215
-5.435
-445.33%
1 ene 1974 año
2.777
+6.991
-165.88%
1 ene 1975 año
15.686
+12.909
464.92%
1 ene 1976 año
7.37
-8.315
-53.01%
1 ene 1977 año
-0.164
-7.535
-102.23%
1 ene 1978 año
0.061
+0.225
-137.21%
1 ene 1979 año
11.938
+11.877
19.44 mil%
1 ene 1980 año
3.272
-8.666
-72.59%
1 ene 1981 año
0.785
-2.487
-76.01%
1 ene 1982 año
36.379
+35.594
4.54 mil%
1 ene 1983 año
0.324
-36.055
-99.11%
1 ene 1984 año
6.635
+6.311
1.95 mil%
1 ene 1985 año
3.707
-2.928
-44.13%
1 ene 1986 año
4.384
+0.677
18.25%
1 ene 1987 año
-0.313
-4.697
-107.15%
1 ene 1988 año
-0.586
-0.273
87.02%
1 ene 1989 año
-9.209
-8.623
1.47 mil%
1 ene 1990 año
5.511
+14.719
-159.84%
1 ene 1991 año
15.133
+9.622
174.61%
1 ene 1992 año
6.111
-9.022
-59.62%
1 ene 1993 año
1.368
-4.743
-77.61%
1 ene 1994 año
9.947
+8.579
627.04%
1 ene 1995 año
6.122
-3.825
-38.45%
1 ene 1996 año
10.859
+4.737
77.37%
1 ene 1997 año
8.092
-2.768
-25.49%
1 ene 1998 año
6.265
-1.827
-22.58%
1 ene 1999 año
-7.491
-13.755
-219.57%
1 ene 2000 año
3.184
+10.674
-142.5%
1 ene 2001 año
0.192
-2.991
-93.96%
1 ene 2002 año
2.091
+1.899
987.8%
1 ene 2003 año
2.441
+0.35
16.73%
1 ene 2004 año
2.507
+0.066
2.72%
1 ene 2005 año
3.575
+1.068
42.61%
1 ene 2006 año
2.581
-0.994
-27.8%
1 ene 2007 año
1.819
-0.762
-29.53%
1 ene 2008 año
3.636
+1.817
99.87%
1 ene 2009 año
3.965
+0.329
9.05%
1 ene 2010 año
3.494
-0.471
-11.88%
1 ene 2011 año
3.375
-0.119
-3.4%
1 ene 2012 año
3.689
+0.314
9.3%
1 ene 2013 año
4.142
+0.453
12.29%
1 ene 2014 año
4.122
-0.02
-0.49%
1 ene 2015 año
3.975
-0.146
-3.55%
1 ene 2016 año
3.579
-0.397
-9.98%
Ranking de los países por los datos estadísticos actuales


Comentarios: