29
/es/
es
AIzaSyAYiBZKx7MnpbEhh9jyipgxe19OcubqV5w
April 1, 2024
37192
IDA & IBRD total
IBT
false
2
1
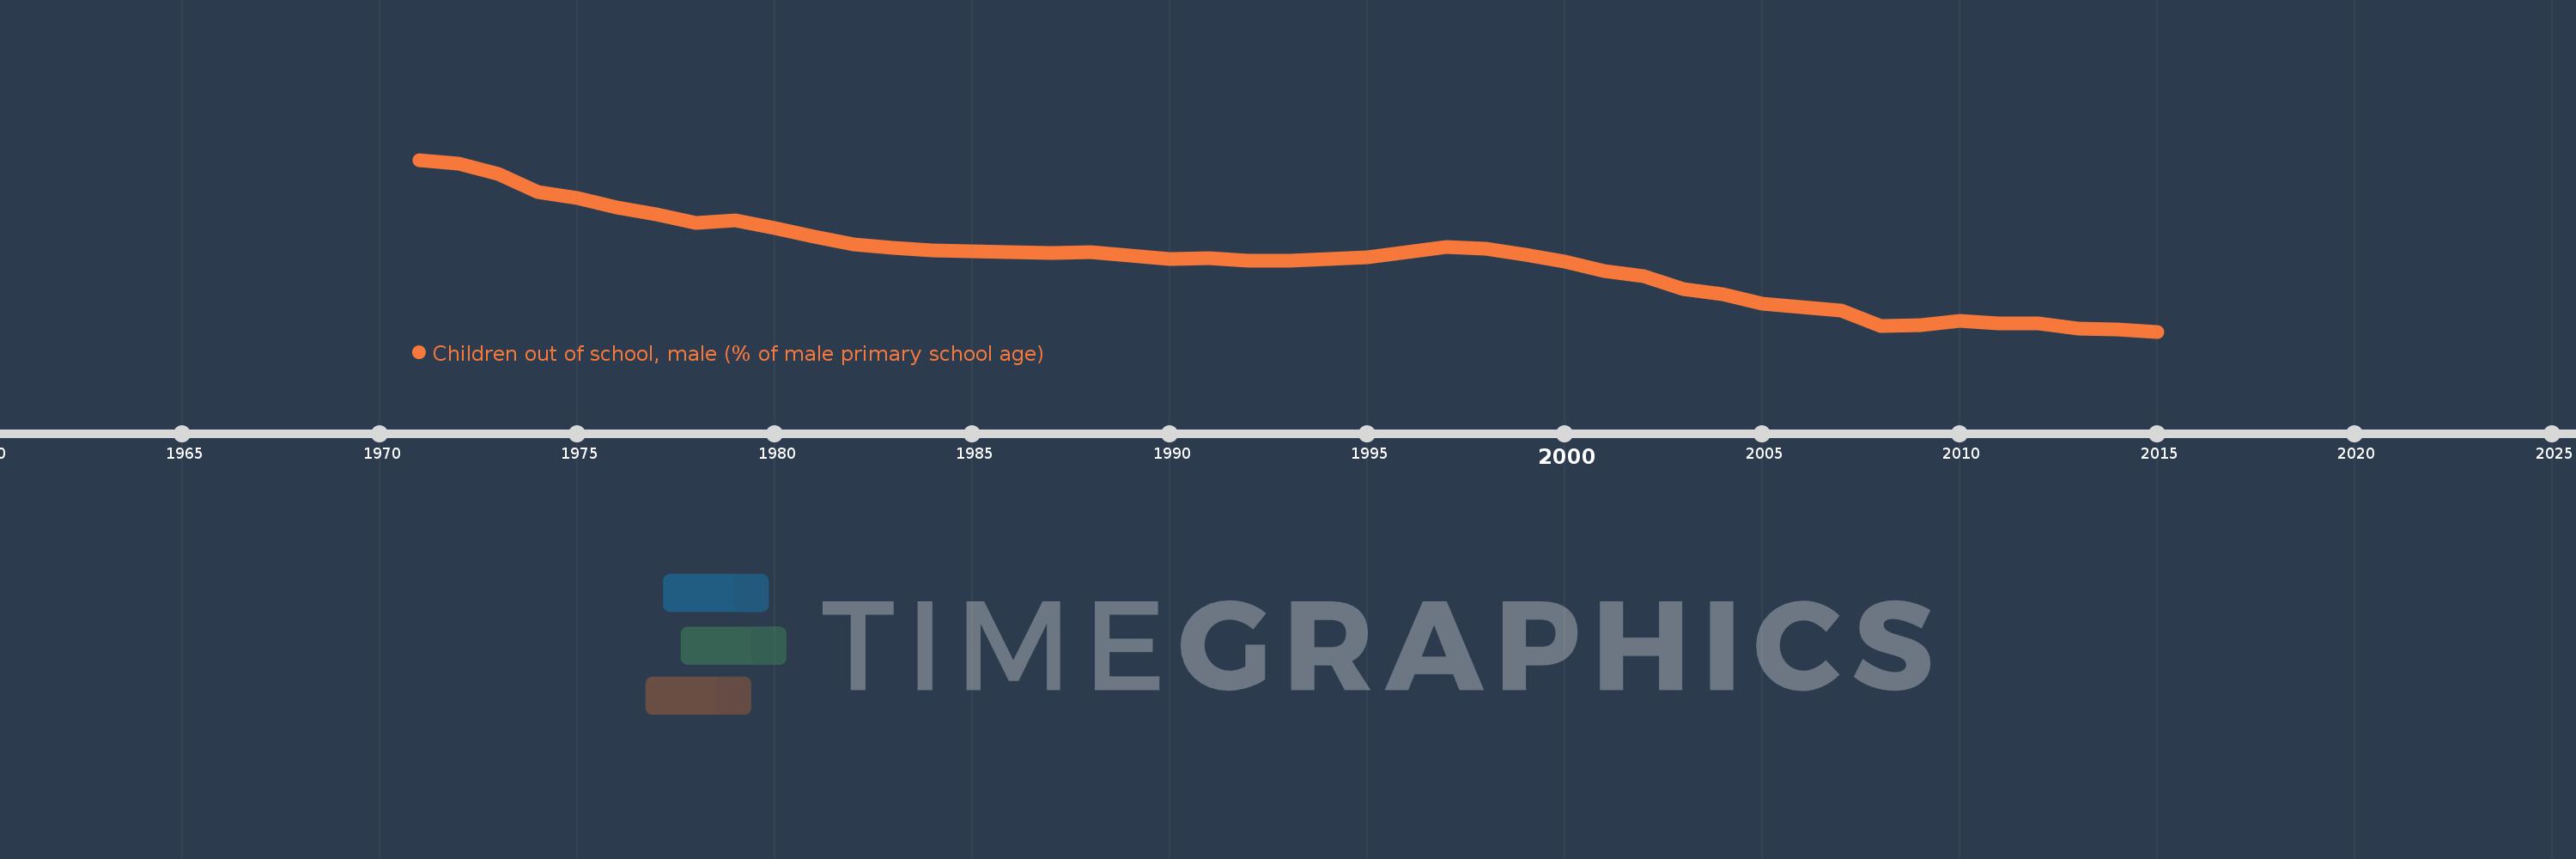
Children out of school, male (% of male primary school age)
2015,2014,2013,2012,2011,2010,2009,2008,2007,2006,2005,2004,2003,2002,2001,2000,1999,1998,1997,1996,1995,1994,1993,1992,1991,1990,1989,1988,1987,1986,1985,1984,1983,1982,1981,1980,1979,1978,1977,1976,1975,1974,1973,1972,1971
Estas estadísticas en otros países:
AfghanistanAlbaniaAlgeriaAngolaAntigua and BarbudaArab WorldArgentinaArmeniaArubaAustraliaAustriaAzerbaijanBahamas, TheBahrainBangladeshBarbadosBelarusBelgiumBelizeBeninBermudaBhutanBoliviaBosnia and HerzegovinaBotswanaBrazilBrunei DarussalamBulgariaBurkina FasoBurundiCabo VerdeCambodiaCameroonCanadaCaribbean small statesCentral African RepublicCentral Europe and the BalticsChadChileChinaColombiaComorosCongo, Dem. Rep.Congo, Rep.Costa RicaCote d'IvoireCroatiaCubaCyprusDenmarkDjiboutiDominicaDominican RepublicEarly-demographic dividendEast Asia & PacificEast Asia & Pacific (excluding high income)East Asia & Pacific (IDA & IBRD countries)EcuadorEgypt, Arab Rep.El SalvadorEquatorial GuineaEritreaEstoniaEthiopiaEuro areaEurope & Central AsiaEurope & Central Asia (excluding high income)Europe & Central Asia (IDA & IBRD countries)European UnionFijiFinlandFragile and conflict affected situationsFranceGabonGambia, TheGeorgiaGhanaGreeceGrenadaGuatemalaGuineaGuinea-BissauGuyanaHaitiHeavily indebted poor countries (HIPC)High incomeHondurasHong Kong SAR, ChinaHungaryIBRD onlyIcelandIDA & IBRD totalIDA blendIDA onlyIDA totalIndiaIndonesiaIran, Islamic Rep.IraqIrelandIsraelItalyJamaicaJapanJordanKazakhstanKenyaKiribatiKorea, Dem. People’s Rep.Korea, Rep.KuwaitKyrgyz RepublicLao PDRLate-demographic dividendLatin America & Caribbean Latin America & Caribbean (excluding high income)Latin America & the Caribbean (IDA & IBRD countries)LatviaLeast developed countries: UN classificationLebanonLesothoLiberiaLibyaLiechtensteinLithuaniaLow & middle incomeLow incomeLower middle incomeLuxembourgMacao SAR, ChinaMacedonia, FYRMadagascarMalawiMaldivesMaliMaltaMarshall IslandsMauritaniaMauritiusMexicoMicronesia, Fed. Sts.Middle East & North AfricaMiddle East & North Africa (excluding high income)Middle East & North Africa (IDA & IBRD countries)Middle incomeMoldovaMongoliaMontenegroMoroccoMozambiqueMyanmarNamibiaNauruNepalNetherlandsNew ZealandNicaraguaNigerNigeriaNorth AmericaNorwayOECD membersOmanOther small statesPacific island small statesPakistanPanamaPapua New GuineaParaguayPeruPhilippinesPolandPortugalPost-demographic dividendPre-demographic dividendPuerto RicoQatarRomaniaRussian FederationRwandaSamoaSan MarinoSao Tome and PrincipeSaudi ArabiaSenegalSerbiaSeychellesSierra LeoneSloveniaSmall statesSolomon IslandsSomaliaSouth AfricaSouth AsiaSouth Asia (IDA & IBRD)South SudanSpainSri LankaSt. Kitts and NevisSt. LuciaSt. Vincent and the GrenadinesSub-Saharan Africa Sub-Saharan Africa (excluding high income)Sub-Saharan Africa (IDA & IBRD countries)SudanSurinameSwazilandSwedenSwitzerlandSyrian Arab RepublicTajikistanTanzaniaThailandTimor-LesteTogoTongaTrinidad and TobagoTunisiaTurkeyTuvaluUgandaUkraineUnited Arab EmiratesUnited KingdomUnited StatesUpper middle incomeUruguayUzbekistanVanuatuVenezuela, RBWest Bank and GazaWorldYemen, Rep.ZambiaZimbabwe línea de tiempo (timeline):
En esta escala de tiempo se presenta un gráfico de 1971 y 2015 de IDA & IBRD total. Los datos de 1970 están ausentes. El número de observaciones reales por fecha: 45.
Fuente (nombre):
Indicadores del desarrollo mundial
Fuente (organización):
United Nations Educational, Scientific, and Cultural Organization (UNESCO) Institute for Statistics.
Categorías:
Education
Se ha actualizado:
23 abr 2017 año
Los indicadores de los cambios de valor en los últimos años
Mínimo:
8.708
1 ene 2015 año
Máximo:
22.484
1 ene 1971 año
A la fecha de observación
Valor
Cambio absoluto
El cambio con respecto al valor anterior
1 ene 1971 año
22.484
+22.484
0.0%
1 ene 1972 año
22.184
-0.3
-1.33%
1 ene 1973 año
21.337
-0.847
-3.82%
1 ene 1974 año
19.909
-1.428
-6.69%
1 ene 1975 año
19.391
-0.518
-2.6%
1 ene 1976 año
18.695
-0.697
-3.59%
1 ene 1977 año
18.093
-0.602
-3.22%
1 ene 1978 año
17.404
-0.689
-3.81%
1 ene 1979 año
17.602
+0.198
1.14%
1 ene 1980 año
16.997
-0.605
-3.44%
1 ene 1981 año
16.298
-0.699
-4.11%
1 ene 1982 año
15.72
-0.577
-3.54%
1 ene 1983 año
15.436
-0.284
-1.81%
1 ene 1984 año
15.187
-0.249
-1.61%
1 ene 1985 año
15.14
-0.047
-0.31%
1 ene 1986 año
15.089
-0.052
-0.34%
1 ene 1987 año
14.99
-0.098
-0.65%
1 ene 1988 año
15.059
+0.069
0.46%
1 ene 1989 año
14.797
-0.262
-1.74%
1 ene 1990 año
14.547
-0.25
-1.69%
1 ene 1991 año
14.614
+0.067
0.46%
1 ene 1992 año
14.363
-0.251
-1.72%
1 ene 1993 año
14.383
+0.02
0.14%
1 ene 1994 año
14.5
+0.117
0.82%
1 ene 1995 año
14.642
+0.142
0.98%
1 ene 1996 año
15.084
+0.442
3.02%
1 ene 1997 año
15.516
+0.432
2.87%
1 ene 1998 año
15.363
-0.153
-0.98%
1 ene 1999 año
14.857
-0.506
-3.29%
1 ene 2000 año
14.302
-0.556
-3.74%
1 ene 2001 año
13.534
-0.768
-5.37%
1 ene 2002 año
13.147
-0.387
-2.86%
1 ene 2003 año
12.101
-1.046
-7.96%
1 ene 2004 año
11.707
-0.394
-3.26%
1 ene 2005 año
10.971
-0.735
-6.28%
1 ene 2006 año
10.662
-0.309
-2.82%
1 ene 2007 año
10.409
-0.253
-2.38%
1 ene 2008 año
9.138
-1.271
-12.21%
1 ene 2009 año
9.196
+0.058
0.64%
1 ene 2010 año
9.601
+0.404
4.39%
1 ene 2011 año
9.373
-0.228
-2.37%
1 ene 2012 año
9.354
-0.019
-0.2%
1 ene 2013 año
8.922
-0.432
-4.62%
1 ene 2014 año
8.846
-0.076
-0.85%
1 ene 2015 año
8.708
-0.137
-1.55%
Ranking de los países por los datos estadísticos actuales


Comentarios: