29
/es/
es
AIzaSyAYiBZKx7MnpbEhh9jyipgxe19OcubqV5w
April 1, 2024
177430
Lesotho
LSO
true
2
1
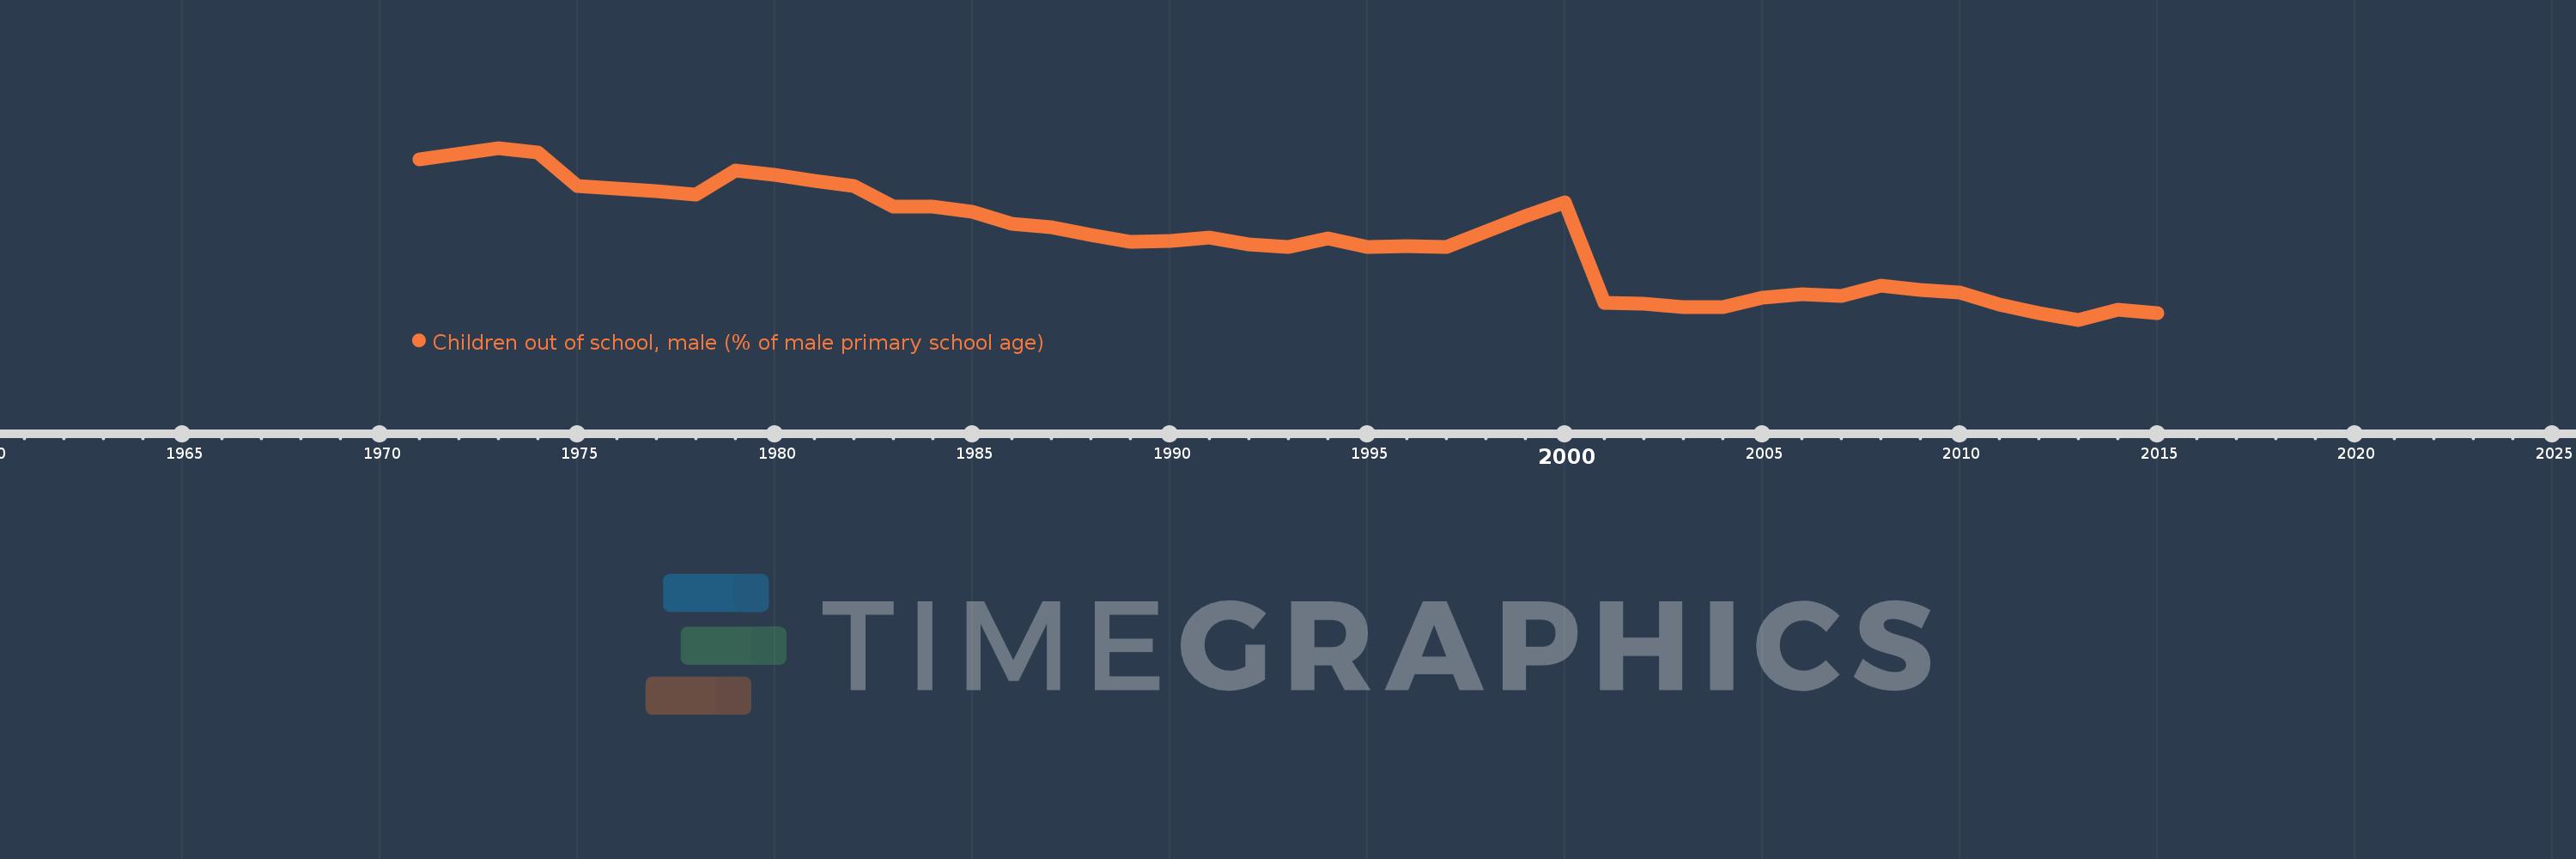
Children out of school, male (% of male primary school age)
2015,2014,2013,2012,2011,2010,2009,2008,2007,2006,2005,2004,2003,2002,2001,2000,1999,1997,1996,1995,1994,1993,1992,1991,1990,1989,1988,1987,1986,1985,1984,1983,1982,1981,1980,1979,1978,1977,1975,1974,1973,1971
Estas estadísticas en otros países:
AfghanistanAlbaniaAlgeriaAngolaAntigua and BarbudaArab WorldArgentinaArmeniaArubaAustraliaAustriaAzerbaijanBahamas, TheBahrainBangladeshBarbadosBelarusBelgiumBelizeBeninBermudaBhutanBoliviaBosnia and HerzegovinaBotswanaBrazilBrunei DarussalamBulgariaBurkina FasoBurundiCabo VerdeCambodiaCameroonCanadaCaribbean small statesCentral African RepublicCentral Europe and the BalticsChadChileChinaColombiaComorosCongo, Dem. Rep.Congo, Rep.Costa RicaCote d'IvoireCroatiaCubaCyprusDenmarkDjiboutiDominicaDominican RepublicEarly-demographic dividendEast Asia & PacificEast Asia & Pacific (excluding high income)East Asia & Pacific (IDA & IBRD countries)EcuadorEgypt, Arab Rep.El SalvadorEquatorial GuineaEritreaEstoniaEthiopiaEuro areaEurope & Central AsiaEurope & Central Asia (excluding high income)Europe & Central Asia (IDA & IBRD countries)European UnionFijiFinlandFragile and conflict affected situationsFranceGabonGambia, TheGeorgiaGhanaGreeceGrenadaGuatemalaGuineaGuinea-BissauGuyanaHaitiHeavily indebted poor countries (HIPC)High incomeHondurasHong Kong SAR, ChinaHungaryIBRD onlyIcelandIDA & IBRD totalIDA blendIDA onlyIDA totalIndiaIndonesiaIran, Islamic Rep.IraqIrelandIsraelItalyJamaicaJapanJordanKazakhstanKenyaKiribatiKorea, Dem. People’s Rep.Korea, Rep.KuwaitKyrgyz RepublicLao PDRLate-demographic dividendLatin America & Caribbean Latin America & Caribbean (excluding high income)Latin America & the Caribbean (IDA & IBRD countries)LatviaLeast developed countries: UN classificationLebanonLesothoLiberiaLibyaLiechtensteinLithuaniaLow & middle incomeLow incomeLower middle incomeLuxembourgMacao SAR, ChinaMacedonia, FYRMadagascarMalawiMaldivesMaliMaltaMarshall IslandsMauritaniaMauritiusMexicoMicronesia, Fed. Sts.Middle East & North AfricaMiddle East & North Africa (excluding high income)Middle East & North Africa (IDA & IBRD countries)Middle incomeMoldovaMongoliaMontenegroMoroccoMozambiqueMyanmarNamibiaNauruNepalNetherlandsNew ZealandNicaraguaNigerNigeriaNorth AmericaNorwayOECD membersOmanOther small statesPacific island small statesPakistanPanamaPapua New GuineaParaguayPeruPhilippinesPolandPortugalPost-demographic dividendPre-demographic dividendPuerto RicoQatarRomaniaRussian FederationRwandaSamoaSan MarinoSao Tome and PrincipeSaudi ArabiaSenegalSerbiaSeychellesSierra LeoneSloveniaSmall statesSolomon IslandsSomaliaSouth AfricaSouth AsiaSouth Asia (IDA & IBRD)South SudanSpainSri LankaSt. Kitts and NevisSt. LuciaSt. Vincent and the GrenadinesSub-Saharan Africa Sub-Saharan Africa (excluding high income)Sub-Saharan Africa (IDA & IBRD countries)SudanSurinameSwazilandSwedenSwitzerlandSyrian Arab RepublicTajikistanTanzaniaThailandTimor-LesteTogoTongaTrinidad and TobagoTunisiaTurkeyTuvaluUgandaUkraineUnited Arab EmiratesUnited KingdomUnited StatesUpper middle incomeUruguayUzbekistanVanuatuVenezuela, RBWest Bank and GazaWorldYemen, Rep.ZambiaZimbabwe línea de tiempo (timeline):
En esta escala de tiempo se presenta un gráfico de 1971 y 2015 de Lesotho. Los datos de 1970 están ausentes. El número de observaciones reales por fecha: 42.
Fuente (nombre):
Indicadores del desarrollo mundial
Fuente (organización):
United Nations Educational, Scientific, and Cultural Organization (UNESCO) Institute for Statistics.
Categorías:
Education
Se ha actualizado:
23 abr 2017 año
Los indicadores de los cambios de valor en los últimos años
Mínimo:
19.657
1 ene 2013 año
Máximo:
55.689
1 ene 1973 año
A la fecha de observación
Valor
Cambio absoluto
El cambio con respecto al valor anterior
1 ene 1971 año
53.262
+53.262
0.0%
1 ene 1973 año
55.689
+2.427
4.56%
1 ene 1974 año
54.662
-1.026
-1.84%
1 ene 1975 año
47.759
-6.903
-12.63%
1 ene 1977 año
46.694
-1.065
-2.23%
1 ene 1978 año
45.977
-0.717
-1.53%
1 ene 1979 año
50.92
+4.942
10.75%
1 ene 1980 año
49.974
-0.946
-1.86%
1 ene 1981 año
48.81
-1.164
-2.33%
1 ene 1982 año
47.661
-1.149
-2.35%
1 ene 1983 año
43.327
-4.334
-9.09%
1 ene 1984 año
43.362
+0.035
0.08%
1 ene 1985 año
42.302
-1.06
-2.44%
1 ene 1986 año
39.728
-2.574
-6.08%
1 ene 1987 año
39.071
-0.657
-1.65%
1 ene 1988 año
37.44
-1.632
-4.18%
1 ene 1989 año
35.93
-1.509
-4.03%
1 ene 1990 año
36.2
+0.27
0.75%
1 ene 1991 año
36.879
+0.679
1.87%
1 ene 1992 año
35.541
-1.338
-3.63%
1 ene 1993 año
34.94
-0.601
-1.69%
1 ene 1994 año
36.731
+1.79
5.12%
1 ene 1995 año
34.953
-1.777
-4.84%
1 ene 1996 año
35.046
+0.092
0.26%
1 ene 1997 año
34.893
-0.153
-0.44%
1 ene 1999 año
41.4
+6.507
18.65%
1 ene 2000 año
44.347
+2.947
7.12%
1 ene 2001 año
23.249
-21.098
-47.58%
1 ene 2002 año
23.032
-0.217
-0.93%
1 ene 2003 año
22.323
-0.709
-3.08%
1 ene 2004 año
22.22
-0.102
-0.46%
1 ene 2005 año
24.306
+2.086
9.39%
1 ene 2006 año
25.076
+0.77
3.17%
1 ene 2007 año
24.719
-0.357
-1.42%
1 ene 2008 año
26.783
+2.064
8.35%
1 ene 2009 año
25.839
-0.944
-3.52%
1 ene 2010 año
25.442
-0.398
-1.54%
1 ene 2011 año
22.88
-2.561
-10.07%
1 ene 2012 año
20.955
-1.926
-8.42%
1 ene 2013 año
19.657
-1.298
-6.19%
1 ene 2014 año
21.853
+2.196
11.17%
1 ene 2015 año
20.999
-0.854
-3.91%
Ranking de los países por los datos estadísticos actuales


Comentarios: